Page 30 - CNB Bank Shares 2018 Annual Report
P. 30

CNB BANK SHARES, INC. AND SUBSIDIARIES                                                                                    CNB BANK SHARES, INC. AND SUBSIDIARIES

                                         Notes to Consolidated Financial Statements                                                                                Notes to Consolidated Financial Statements


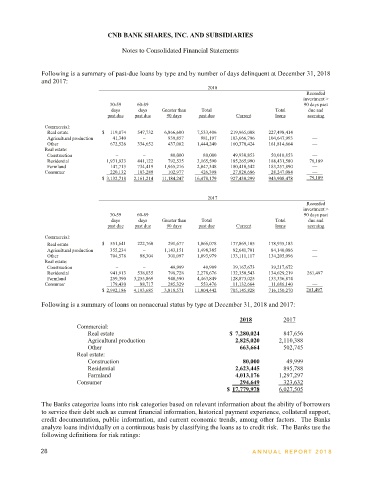
               Following is a summary of past-due loans by type and by number of days delinquent at December 31, 2018
               and 2017:                                                                                                                   ▪  Watch – Loans classified as watch have potential weaknesses that deserve management’s close attention.
                                                                     2018                                                                    If left uncorrected, these potential weaknesses may result in deterioration of the repayment prospects for
                                                                                                      Recorded
                                                                                                     investment >                            the loan or of the Banks’ credit position at some future date.
                                     30-59    60-89                                                  90 days past
                                      days     days   Greater than   Total                  Total      due and                             ▪  Substandard – Loans classified as substandard are inadequately protected by the current sound worth
                                    past due   past due   90 days   past due   Current      loans     accruing
                                                                                                                                             and paying capacity of the borrower or of the collateral pledged, if any.  Loans so classified have a well-
                Commercial:                                                                                                                  defined weakness or weaknesses that jeopardize the liquidation of the debt.  They are characterized by
                  Real estate      $  119,074   547,732   6,866,600   7,533,406   219,965,008   227,498,414   —                              the distinct possibility that the Banks will sustain some loss if the deficiencies are not corrected.
                  Agricultural production   41,340   −   939,857   981,197   103,666,796   104,647,993   —
                  Other              672,526   334,652   437,062   1,444,240   160,370,424   161,814,664   —
                Real estate:                                                                                                               ▪  Doubtful  –  Loans classified as doubtful have all the weaknesses inherent in those classified as
                  Construction         −        −        80,000     80,000    49,930,853   50,010,853   —                                    substandard, with the added characteristic that the weaknesses make collection or liquidation in full, on
                  Residential       1,931,933   441,122   792,535   3,165,590   185,265,990   188,431,580   79,189
                  Farmland           147,713   734,419   1,965,216   2,847,348   180,410,542   183,257,890   —                               the basis of currently existing factors, conditions, and values, highly questionable and improbable.
                Consumer               220,132     103,289       102,977      426,398       27,820,686       28,247,084       —
                                   $  3,132,718   2,161,214   11,184,247     16,478,179   927,430,299   943,908,478       79,189         Loans not meeting the criteria above that are analyzed individually as part of the above-described process are

                                                                                                                                         considered pass-rated loans.
                                                                     2017
                                                                                                      Recorded                           The following table presents the credit risk profile of the Banks’ loan portfolio based on rating category as of
                                                                                                     investment >                        December 31, 2018 and 2017:
                                     30-59    60-89                                                  90 days past
                                      days     days   Greater than   Total                  Total      due and
                                    past due   past due   90 days   past due   Current      loans     accruing                                                                                  2018
                                                                                                                                                         Commercial   Agricultural   Commercial   Real estate   Residential
                Commercial:                                                                                                                 Grade          real estate     production       other     construction   real estate   Farmland   Consumer   Total
                  Real estate      $  551,641   222,760   291,677   1,066,078   177,869,105   178,935,183   —
                  Agricultural production   355,234   −   1,143,151   1,498,385   82,641,701   84,140,086   —                            Pass          $  209,666,003   95,077,078   149,612,983   49,930,853  182,683,984  165,019,154   27,400,881   879,390,936
                  Other              704,578   88,304   301,097   1,093,979   133,111,117   134,205,096   —                              Watch             7,174,176   3,405,058   10,200,856   −   1,370,128  12,038,226   50,621   34,239,065
                Real estate:                                                                                                             Substandard      10,658,235   6,165,857   2,000,825   80,000   4,377,468   6,200,510   795,582   30,278,477
                  Construction         −        −        49,999     49,999    39,167,673   39,217,672   —                                Doubtful           −          −          −          −        −        −         −         −
                  Residential        941,913   538,035   798,728   2,278,676   132,350,543   134,629,219   261,497                                     $  227,498,414   104,647,993   161,814,664   50,010,853  188,431,580  183,257,890   28,247,084   943,908,478
                  Farmland           259,390   3,255,869   948,590   4,463,849   128,873,025   133,336,874   —
                Consumer               179,430      88,717        285,329      553,476       11,132,664       11,686,140       —                                                                2017
                                   $  2,992,186   4,193,685      3,818,571     11,004,442   705,145,828   716,150,270     261,497                        Commercial   Agricultural   Commercial   Real estate   Residential
                                                                                                                                              Grade        real estate     production       other     construction   real estate   Farmland   Consumer   Total
               Following is a summary of loans on nonaccrual status by type at December 31, 2018 and 2017:                               Pass          $  174,829,304   77,236,672   132,681,460   39,167,673  132,333,051  115,799,548   11,261,705   683,309,413
                                                                                                                                         Watch             2,432,215   2,044,721   709,222   −      1,138,074   7,673,817   71,634   14,069,683
                                                                                2018          2017                                       Substandard       1,673,664   4,858,693   814,414   49,999   1,158,094   9,863,509   352,801   18,771,174

                                                                                                                                                                                                      −
                                                                                                                                                                                            −
                                                                                                                                                                                                               −

                                                                                                                                                            −

                                                                                                                                                                       −
                                                                                                                                                                                  −
                                                                                                                                                                                                                         −
                                                                                                                                                                                                                                   −
                          Commercial:                                                                                                    Doubtful      $  178,935,183         84,140,086       134,205,096       39,217,672  134,629,219  133,336,874       11,686,140       716,150,270

                              Real estate                                    $  7,280,024     847,656
                              Agricultural production                          2,825,020     2,110,388                                   The Banks seek to assist customers that are experiencing financial difficulty by renegotiating loans within
                              Other                                             663,664       502,745                                    lending regulations and guidelines.  A loan modification is considered a troubled debt restructuring when a
                          Real estate:
                              Construction                                       80,000        49,999                                    concession has been granted to a borrower experiencing financial difficulties.  The Banks’ modifications
                              Residential                                      2,623,445      895,788                                    generally include interest rate adjustments,  and amortization and maturity date extensions.  These
                              Farmland                                         4,013,176     1,297,297                                   modifications allow the borrowers short-term cash relief to allow them to improve their financial condition.
                          Consumer                                               294,649       323,632                                   The Banks’  troubled debt  restructured loans are considered impaired and are individually evaluated for
                                                                            $ 17,779,978     6,027,505                                   impairment as part of the reserve for possible loan losses as described above.

               The Banks categorize loans into risk categories based on relevant information about the ability of borrowers
               to service their debt such as current financial information, historical payment experience, collateral support,
               credit documentation, public information, and current economic trends, among other factors.  The Banks
               analyze loans individually on a continuous basis by classifying the loans as to credit risk.  The Banks use the
               following definitions for risk ratings:
              28                                                                    ANNUAL REPOR T 2018                                  ANNUAL REPOR T 2018                                                                          29
   25   26   27   28   29   30   31   32   33   34   35