
Page 25 - CNB Bank Shares 2018 Annual Report
P. 25
CNB BANK SHARES, INC. AND SUBSIDIARIES CNB BANK SHARES, INC. AND SUBSIDIARIES
Notes to Consolidated Financial Statements Notes to Consolidated Financial Statements
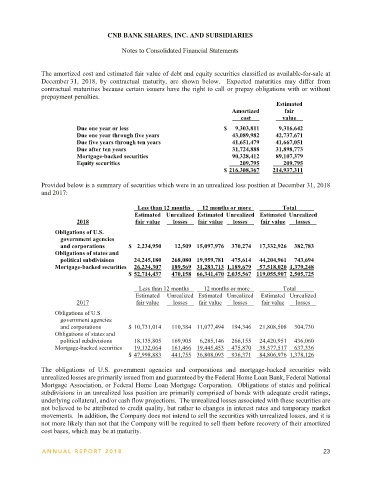
Reclassifications The amortized cost and estimated fair value of debt and equity securities classified as available-for-sale at
Certain reclassifications have been made to the 2017 consolidated financial statement amounts to conform to December 31, 2018, by contractual maturity, are shown below. Expected maturities may differ from
the 2018 presentation. Such reclassifications have no effect on the previously reported consolidated net contractual maturities because certain issuers have the right to call or prepay obligations with or without
income or stockholders’ equity. prepayment penalties.
Estimated
Subsequent Events Amortized fair
The Company has considered all events occurring subsequent to December 31, 2018 for possible disclosure cost value
through February 19, 2019, the date these consolidated financial statements were available to be issued. Due one year or less $ 9,303,811 9,316,642
Due one year through five years 43,089,982 42,737,671
NOTE 2 – CASH AND DUE FROM BANKS Due five years through ten years 41,651,479 41,667,051
The Banks are generally required to maintain certain daily reserve balances on hand in accordance with Due after ten years 31,724,888 31,898,773
regulatory requirements. The reserve balances maintained in accordance with such requirements at Mortgage-backed securities 90,328,412 89,107,379
December 31, 2018 and 2017 were approximately $2,879,000 and $0, respectively. Equity securities 209,795 209,795
$ 216,308,367 214,937,311
NOTE 3 – INVESTMENTS IN DEBT AND EQUITY SECURITIES Provided below is a summary of securities which were in an unrealized loss position at December 31, 2018
The amortized cost, gross unrealized gains and losses, and estimated fair value of debt and equity securities
classified as available-for-sale at December 31, 2018 and 2017 are as follows: and 2017:
Less than 12 months 12 months or more Total
Gross Gross Estimated Unrealized Estimated Unrealized Estimated Unrealized
unreal- unreal- Estimated 2018 fair value losses fair value losses fair value losses
Amortized ized ized fair
2018 cost gains losses value Obligations of U.S.
Obligations of U.S. government agencies
government agencies and corporations $ 2,234,950 12,509 15,097,976 370,274 17,332,926 382,783
and corporations $ 24,112,625 57,351 (382,783) 23,787,193 Obligations of states and
Obligations of states and political subdivisions 24,245,180 268,080 19,959,781 475,614 44,204,961 743,694
political subdivisions 101,657,535 919,103 (743,694) 101,832,944 Mortgage-backed securities 26,234,307 189,569 31,283,713 1,189,679 57,518,020 1,379,248
Mortgage-backed securities 90,328,412 158,215 (1,379,248) 89,107,379 $ 52,714,437 470,158 66,341,470 2,035,567 119,055,907 2,505,725
Equity securities 209,795 − − 209,795
$ 216,308,367 1,134,669 (2,505,725) 214,937,311 Less than 12 months 12 months or more Total
Estimated Unrealized Estimated Unrealized Estimated Unrealized
Gross Gross 2017 fair value losses fair value losses fair value losses
unreal- unreal- Estimated Obligations of U.S.
Amortized ized ized fair government agencies
2017 cost gains losses value and corporations $ 10,731,014 110,384 11,077,494 194,346 21,808,508 304,730
Obligations of U.S. Obligations of states and
government agencies political subdivisions 18,135,805 169,905 6,285,146 266,155 24,420,951 436,060
and corporations $ 23,862,855 367 (304,730) 23,558,492 Mortgage-backed securities 19,132,064 161,466 19,445,453 475,870 38,577,517 637,336
Obligations of states and $ 47,998,883 441,755 36,808,093 936,371 84,806,976 1,378,126
political subdivisions 76,153,881 917,104 (436,060) 76,634,925
Mortgage-backed securities 48,941,531 191,597 (637,336) 48,495,792
Equity securities 206,042 − − 206,042 The obligations of U.S. government agencies and corporations and mortgage-backed securities with
$ 149,164,309 1,109,068 (1,378,126) 148,895,251 unrealized losses are primarily issued from and guaranteed by the Federal Home Loan Bank, Federal National
Mortgage Association, or Federal Home Loan Mortgage Corporation. Obligations of states and political
subdivisions in an unrealized loss position are primarily comprised of bonds with adequate credit ratings,
underlying collateral, and/or cash flow projections. The unrealized losses associated with these securities are
not believed to be attributed to credit quality, but rather to changes in interest rates and temporary market
movements. In addition, the Company does not intend to sell the securities with unrealized losses, and it is
not more likely than not that the Company will be required to sell them before recovery of their amortized
cost bases, which may be at maturity.
22 ANNUAL REPOR T 2018 ANNUAL REPOR T 2018 23