
Page 59 - Journal of Management Inquiry, July 2018
P. 59
Gärtner and Huber 273
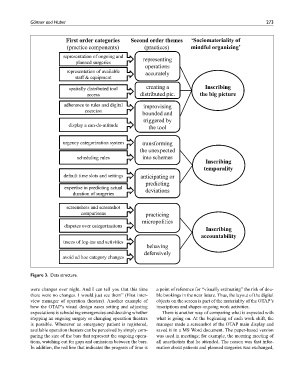
Figure 3. Data structure.
were changes over night. And I can tell you that this time a point of reference for “visually estimating” the risk of dou-
there were no changes. I would just see them” (First inter- ble bookings in the near future. Thus, the layout of the digital
view manager of operation theaters). Another example of objects on the screen is part of the materiality of the OTAP’s
how the OTAP’s visual design eases setting and adjusting inscriptions and shapes ongoing work activities.
expectations is scheduling emergencies and deciding whether There is another way of comparing what is expected with
stopping an ongoing surgery or changing operation theaters what is going on. At the beginning of each work shift, the
is possible. Whenever an emergency patient is registered, manager made a screenshot of the OTAP main display and
available operation theaters can be perceived by simply com- saved it in a MS Word document. The paper-based version
paring the size of the bars that represent the ongoing opera- was used in meetings; for example, the morning meeting of
tions, watching out for gaps and omissions between the bars. all anesthetists that he attended. The reason was that infor-
In addition, the red line that indicates the progress of time is mation about patients and planned surgeries was exchanged,