
Page 106 - SAPEM-Chapter-10-2nd-edition-2014
P. 106
South African Pavement Engineering Manual
Chapter 10: Pavement Design
• Number of blows DSN d required to penetrate to depth “d”. Typically, a depth of 800 mm is used, denoted
DSN 800 .
• Relative contribution of the individual pavement layers to the strength of the total pavement system, also referred
to as the pavement strength balance.
A DCP penetration rate is required for any material to be used in the DCP design method. Correlations to convert the
penetration rate (DN) to a CBR, UCS and effective stiffness are available, with the best known correlations reported
by Kleyn et al (1989) and de Beer (1991). Based on the correlations and minimum strength requirements for
unbound and cement stabilized material, recommended typical DN values are given in Table 42.
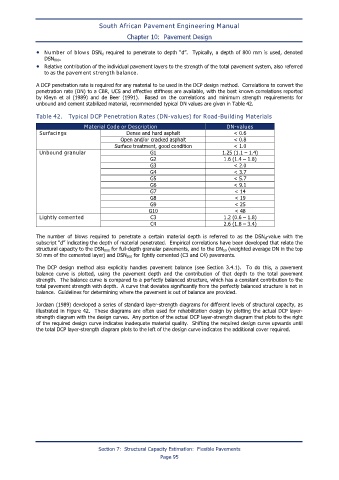
Table 42. Typical DCP Penetration Rates (DN-values) for Road-Building Materials
Material Code or Description DN-values
Surfacings Dense and hard asphalt < 0.6
Open and/or cracked asphalt < 0.8
Surface treatment, good condition < 1.0
Unbound granular G1 1.25 (1.1 – 1.4)
G2 1.6 (1.4 – 1.8)
G3 < 2.0
G4 < 3.7
G5 < 5.7
G6 < 9.1
G7 < 14
G8 < 19
G9 < 25
G10 < 48
Lightly cemented C3 1.2 (0.6 – 1.8)
C4 2.6 (1.8 – 3.4)
The number of blows required to penetrate a certain material depth is referred to as the DSN d -value with the
subscript “d” indicating the depth of material penetrated. Empirical correlations have been developed that relate the
structural capacity to the DSN 800 for full-depth granular pavements, and to the DN 50 (weighted average DN in the top
50 mm of the cemented layer) and DSN 200 for lightly cemented (C3 and C4) pavements.
The DCP design method also explicitly handles pavement balance (see Section 3.4.1). To do this, a pavement
balance curve is plotted, using the pavement depth and the contribution of that depth to the total pavement
strength. The balance curve is compared to a perfectly balanced structure, which has a constant contribution to the
total pavement strength with depth. A curve that deviates significantly from the perfectly balanced structure is not in
balance. Guidelines for determining where the pavement is out of balance are provided.
Jordaan (1989) developed a series of standard layer-strength diagrams for different levels of structural capacity, as
illustrated in Figure 42. These diagrams are often used for rehabilitation design by plotting the actual DCP layer-
strength diagram with the design curves. Any portion of the actual DCP layer-strength diagram that plots to the right
of the required design curve indicates inadequate material quality. Shifting the required design curve upwards until
the total DCP layer-strength diagram plots to the left of the design curve indicates the additional cover required.
Section 7: Structural Capacity Estimation: Flexible Pavements
Page 95