
Page 301 - C:\Users\azizu\Documents\Flip PDF Professional\Matematics-Form-1-1\
P. 301
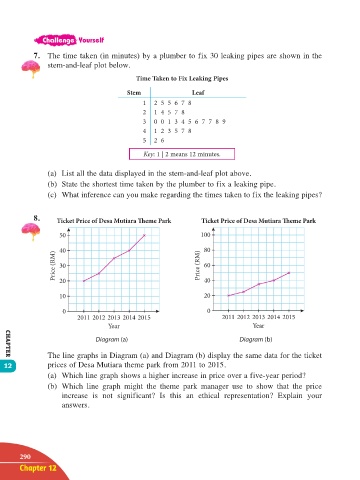
7.  The time taken (in minutes) by a plumber to fix 30 leaking pipes are shown in the
                   stem-and-leaf plot below.
                                              Time Taken to Fix Leaking Pipes

                                           Stem                Leaf
                                                1  2  5  5  6  7  8
                                                2  1  4  5  7  8
                                                3  0  0  1  3  4  5  6  7  7  8  9
                                                4  1  2  3  5  7  8
                                                5  2  6
                                                Key: 1 | 2 means 12 minutes.


                   (a)  List all the data displayed in the stem-and-leaf plot above.
                   (b)  State the shortest time taken by the plumber to fix a leaking pipe.
                   (c)  What inference can you make regarding the times taken to fix the leaking pipes?


               8.     Ticket Price of Desa Mutiara  eme Park      Ticket Price of Desa Mutiara  eme Park

                       50                                        100
                       40                                         80
                      Price (RM)  30                             Price (RM)  60


                                                                  40
                       20
                       10                                         20

                        0                                          0
                            2011 2012 2013 2014 2015                    2011 2012 2013 2014 2015
                                      Year                                       Year
                                  Diagram (a)                                Diagram (b)

                   The line graphs in Diagram (a) and Diagram (b) display the same data for the ticket
       CHAPTER
      12           prices of Desa Mutiara theme park from 2011 to 2015.
                   (a)  Which line graph shows a higher increase in price over a five-year period?
                   (b)  Which  line  graph might  the  theme  park manager use to  show that  the  price
                        increase  is not significant?  Is this an ethical  representation?  Explain  your
                        answers.


           290
           Chapter 12


       12 TB Math F1.indd   290                                                                       11/10/16   12:21 PM