Page 296 - C:\Users\azizu\Documents\Flip PDF Professional\Matematics-Form-1-1\
P. 296

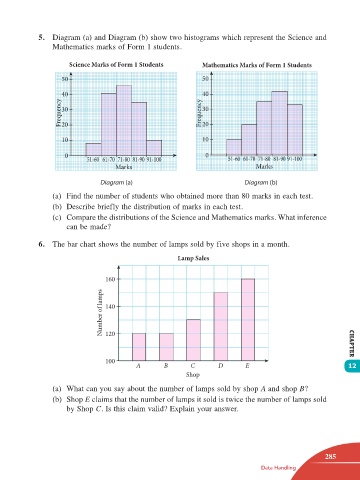
5.  Diagram (a) and Diagram (b) show two histograms which represent the Science and
                     Mathematics marks of Form 1 students.

                          Science Marks of Form 1 Students        Mathematics Marks of Form 1 Students
                        50                                        50

                        40                                        40
                       Frequency  30                             Frequency  30


                                                                  20
                        20
                        10                                        10

                         0     51-60 61-70 71-80 81-90 91-100      0      51-60 61-70 71-80 81-90 91-100
                                        Marks                                     Marks

                                   Diagram (a)                                 Diagram (b)
                     (a)  Find the number of students who obtained more than 80 marks in each test.
                     (b)  Describe briefly the distribution of marks in each test.
                     (c)  Compare the distributions of the Science and Mathematics marks. What inference
                         can be made?


                 6.  The bar chart shows the number of lamps sold by five shops in a month.
                                                          Lamp Sales


                                     160

                                    Number of lamps  140


                                     120


                                     100                                                                      CHAPTER
                                              A       B       C        D       E                              12
                                                             Shop
                     (a)  What can you say about the number of lamps sold by shop A and shop B?
                     (b)  Shop E claims that the number of lamps it sold is twice the number of lamps sold
                         by Shop C. Is this claim valid? Explain your answer.


                                                                                                       285
                                                                                   Data Handling


       12 TB Math F1.indd   285                                                                       11/10/16   12:21 PM
   291   292   293   294   295   296   297   298   299   300   301