Page 293 - C:\Users\azizu\Documents\Flip PDF Professional\Matematics-Form-1-1\
P. 293

What is the importance of representing data ethically?


               Data  representations help  us to analyse  and  interpret  data     LEARNING
               much easier. We need to represent the data ethically to avoid             STANDARDS
               confusion.                                                       Discuss the importance
                                                                                of representing data
               To represent the data ethically,                                 ethically in order to
               •  the scale used in the representation must be consistent and   avoid confusion.
                  start at 0.
               •  the data displayed must be accurate.


                                                                                  Football Goalscoring
                           15
                                                                              14
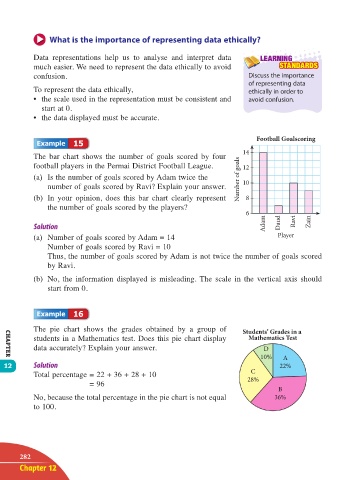
               The  bar chart shows  the number of goals scored by four
               football players in the Permai District Football League.       12
               (a)  Is the number of goals scored by Adam twice the          Number of goals
                   number of goals scored by Ravi? Explain your answer.       10
               (b)  In  your opinion, does this bar chart  clearly  represent   8
                   the number of goals scored by the players?
                                                                               6
                                                                                     Adam  Daud  Ravi  Zain

               (a)  Number of goals scored by Adam = 14                                 Player
                   Number of goals scored by Ravi = 10
                   Thus, the number of goals scored by Adam is not twice the number of goals scored
                   by Ravi.
               (b)  No,  the  information displayed  is misleading. The scale  in the  vertical  axis should
                   start from 0.


                           16

               The pie chart shows  the grades obtained by a group of         Students’ Grades in a
               students in a Mathematics test. Does this pie chart display      Mathematics Test
               data accurately? Explain your answer.                                D
                                                                                   10%    A
       CHAPTER
      12                                                                                 22%
                                                                                C
               Total percentage = 22 + 36 + 28 + 10                            28%
                                = 96
                                                                                         B
               No, because the total percentage in the pie chart is not equal          36%
               to 100.


           282
           Chapter 12


       12 TB Math F1.indd   282                                                                       11/10/16   12:21 PM
   288   289   290   291   292   293   294   295   296   297   298