Page 294 - C:\Users\azizu\Documents\Flip PDF Professional\Matematics-Form-1-1\
P. 294

Self Practice      12.1e

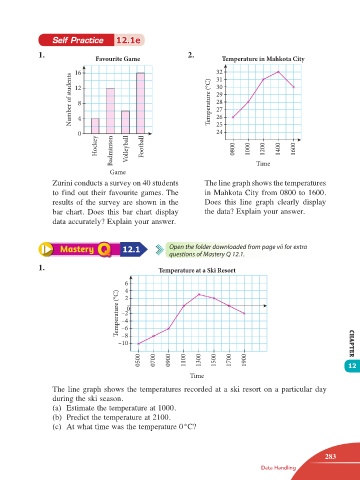
                 1.               Favourite Game              2.        Temperature in Mahkota City

                            16                                        32
                          Number of students  12                    Temperature (°C)  30
                                                                      31
                                                                      29
                                                                      28
                             8
                                                                      27
                                                                      26
                             4
                                                                      24
                             0                                        25
                                  Hockey  Badminton  Volleyball  Football  0800  1000  1200  1400  1600


                                      Game                                        Time
                     Zurini conducts a survey on 40 students       The line graph shows the temperatures
                     to find out their favourite games. The        in Mahkota City from 0800 to 1600.
                     results of the survey are shown in the        Does  this line graph clearly display
                     bar chart. Does this bar chart  display       the data? Explain your answer.
                     data accurately? Explain your answer.


                                          12.1          Open the folder downloaded from page vii for extra
                                                        questions of Mastery Q 12.1.
                 1.                                  Temperature at a Ski Resort

                                           6
                                           4
                                         Temperature (°C)  –2 0
                                           2


                                          –4
                                          –6
                                          –8
                                         –10                                                                  CHAPTER

                                               0500  0700  0900  1100  1300  1500  1700  1900                 12

                                                              Time

                     The line graph shows the temperatures recorded at a ski resort on a particular day
                     during the ski season.
                     (a)  Estimate the temperature at 1000.
                     (b)  Predict the temperature at 2100.
                     (c)  At what time was the temperature 0 °C?


                                                                                                       283
                                                                                   Data Handling


       12 TB Math F1.indd   283                                                                       11/10/16   12:21 PM
   289   290   291   292   293   294   295   296   297   298   299