
Page 289 - C:\Users\azizu\Documents\Flip PDF Professional\Matematics-Form-1-1\
P. 289
(a) 1 900 tonnes
(b) The mass of waste produced in 2011 and 2014 are Think and state the
the same. possible reasons for
(c) Total mass of waste produced over a period of 6 years the gradual decrease
in waste production
= 1 900 + 2 100 + 2 900 + 2 600 + 2 100 + 1 600 in a city year by year.
= 13 200 tonnes
13 200
Mean mass of waste =
6
= 2 200 tonnes
(d) The mass of waste produced decreases each year after the year 2012.
(e) 1 100 tonnes
12
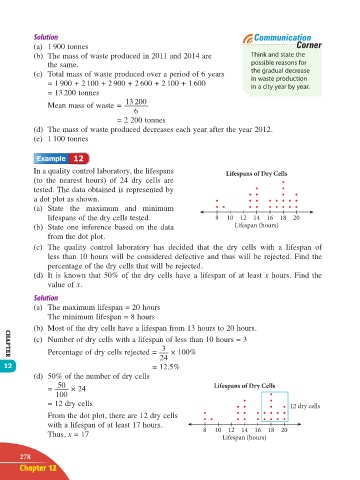
In a quality control laboratory, the lifespans Lifespans of Dry Cells
(to the nearest hours) of 24 dry cells are
tested. The data obtained is represented by
a dot plot as shown.
(a) State the maximum and minimum
lifespans of the dry cells tested. 8 10 12 14 16 18 20
(b) State one inference based on the data Lifespan (hours)
from the dot plot.
(c) The quality control laboratory has decided that the dry cells with a lifespan of
less than 10 hours will be considered defective and thus will be rejected. Find the
percentage of the dry cells that will be rejected.
(d) It is known that 50% of the dry cells have a lifespan of at least x hours. Find the
value of x.
(a) The maximum lifespan = 20 hours
The minimum lifespan = 8 hours
(b) Most of the dry cells have a lifespan from 13 hours to 20 hours.
(c) Number of dry cells with a lifespan of less than 10 hours = 3
3
Percentage of dry cells rejected = × 100%
24
CHAPTER
12 = 12.5%
(d) 50% of the number of dry cells
50 Lifespans of Dry Cells
= × 24
100
= 12 dry cells 12 dry cells
From the dot plot, there are 12 dry cells
with a lifespan of at least 17 hours. 8 10 12 14 16 18 20
Thus, x = 17 Lifespan (hours)
278
Chapter 12
12 TB Math F1.indd 278 11/10/16 12:21 PM