Page 286 - C:\Users\azizu\Documents\Flip PDF Professional\Matematics-Form-1-1\
P. 286

4.  The table shows Kamil’s height over a period of six years. Construct a line graph to
                     represent the data and justify the appropriateness of the data representation.

                          Year        2011       2012      2013      2014      2015       2016
                       Height (cm)     145       150       153        160       164       167


                 5.  The  data shows  the number of text messages sent by a group of students on a
                     particular day. Represent the data by using a dot plot and justify the appropriateness
                     of the data representation.

                                           3       4       8        7       11
                                           6       5       7        6       3
                                           9       6       5       11       8


                 6.  In a survey, the ages of 24 readers of a magazine are recorded as follows. Represent
                     the  data by using  a stem-and-leaf  plot  and  justify the  appropriateness  of the  data
                     representation.

                                    44     53     33     65     51      30     42     34
                                    57     36     51     32     39      44     25     31
                                    58     47     31     22     58      38     60     47


                      How do you convert a data representation to                    LEARNING
                      another representation?                                             STANDARDS
                                                                                   Convert a data
                 A  data representation  can be converted  to other  suitable      representation to
                 representations for further analysis.                             other suitable data
                                                                                   representations
                                                                                   with justification.


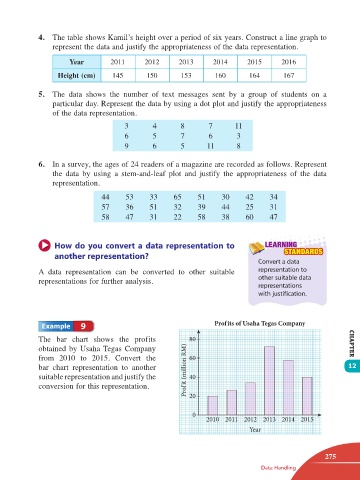
                             9                                       Prof its of Usaha Tegas Company

                 The  bar chart shows the  profits            80
                 obtained by Usaha Tegas Company                                                              CHAPTER
                 from  2010  to 2015.  Convert  the           60
                 bar chart  representation  to another       Prof it (million RM)                             12
                 suitable representation and justify the      40
                 conversion for this representation.          20


                                                               0
                                                                   2010 2011 2012 2013 2014 2015
                                                                                Year


                                                                                                       275
                                                                                   Data Handling


       12 TB Math F1.indd   275                                                                       11/10/16   12:21 PM
   281   282   283   284   285   286   287   288   289   290   291