
Page 287 - C:\Users\azizu\Documents\Flip PDF Professional\Matematics-Form-1-1\
P. 287
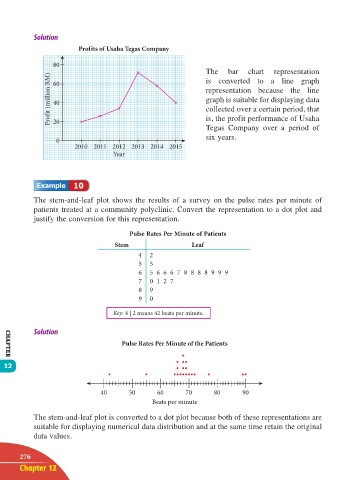
Prof its of Usaha Tegas Company

                     80
                                                                   The bar chart representation
                    Prof t (million RM)  i  40                     representation  because the line
                                                                   is converted  to a line  graph
                     60

                                                                   graph is suitable for displaying data
                                                                   collected over a certain period, that
                                                                   is, the profit performance of Usaha
                     20
                                                                   Tegas Company over a period of
                      0                                            six years.
                            2010 2011 2012 2013 2014 2015
                                       Year


                           10

               The stem-and-leaf plot shows the  results  of a  survey on the  pulse rates  per  minute of
               patients treated at a community polyclinic. Convert the representation to a dot plot and
               justify the conversion for this representation.
                                            Pulse Rates Per Minute of Patients

                                        Stem                   Leaf
                                               4  2
                                               5  5
                                               6  5  6  6  6  7  8  8  8  8  9  9  9
                                               7  0  1  2  7
                                               8  9
                                               9  0

                                       Key: 4 | 2 means 42 beats per minute.


                                          Pulse Rates Per Minute of the Patients

       CHAPTER
      12


                                   40       50      60       70      80       90
                                                   Beats per minute

               The stem-and-leaf plot is converted to a dot plot because both of these representations are
               suitable for displaying numerical data distribution and at the same time retain the original
               data values.


           276
           Chapter 12


       12 TB Math F1.indd   276                                                                       11/10/16   12:21 PM