Page 290 - C:\Users\azizu\Documents\Flip PDF Professional\Matematics-Form-1-1\
P. 290

Histogram
                 A histogram is a data representation that displays grouped data. Grouped data is data that
                 is collected in intervals.
                             13
                                                                                   id   ou   now
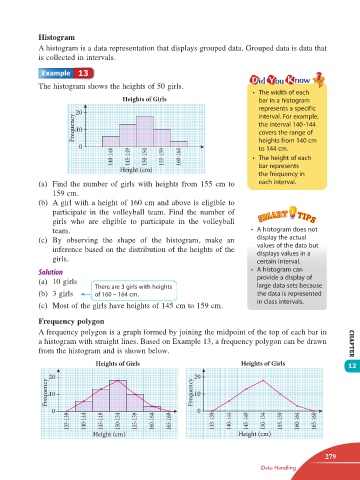
                 The histogram shows the heights of 50 girls.
                                                                                 •  The width of each
                                          Heights of Girls                         bar in a histogram
                                                                                   represents a specific
                           Frequency 20                                            the interval 140 -144
                                                                                   interval. For example,
                            10
                                                                                   covers the range of
                             0                                                     heights from 140 cm
                                                                                   to 144 cm.
                                       140-144  145-149  150-154  155-159  160-164  •  The height of each

                                         Height (cm)                               bar represents
                                                                                   the frequency in
                 (a)  Find the number of girls with heights from 155 cm to         each interval.
                     159 cm.
                 (b)  A girl with a height of 160 cm and above is eligible to
                     participate  in the volleyball team. Find the number of
                     girls  who are eligible  to participate  in the volleyball
                     team.                                                      •  A histogram does not
                 (c)  By  observing the shape of the histogram,  make  an         display the actual
                     inference based on the distribution of the heights of the    values of the data but
                                                                                  displays values in a
                     girls.                                                       certain interval.

                                                                                •  A histogram can
                 (a)  10 girls                                                    provide a display of
                                  There are 3 girls with heights                  large data sets because
                 (b)  3 girls     of 160 – 164 cm.                                the data is represented
                                                                                  in class intervals.
                 (c)  Most of the girls have heights of 145 cm to 159 cm.

                 Frequency polygon
                 A frequency polygon is a graph formed by joining the midpoint of the top of each bar in
                 a histogram with straight lines. Based on Example 13, a frequency polygon can be drawn       CHAPTER
                 from the histogram and is shown below.
                                  Heights of Girls                           Heights of Girls                 12
                   Frequency 20                                Frequency 20

                                                               10
                    10
                     0                                          0
                          135-139  140-144  145-149  150-154  155-159  160-164  165-169  135-139  140-144  145-149  150-154  155-159  160-164  165-169

                                 Height (cm)                                 Height (cm)


                                                                                                       279
                                                                                   Data Handling


       12 TB Math F1.indd   279                                                                       11/10/16   12:21 PM
   285   286   287   288   289   290   291   292   293   294   295