
Page 295 - C:\Users\azizu\Documents\Flip PDF Professional\Matematics-Form-1-1\
P. 295
2.
Animal Cheetah Zebra Lion Horse Deer Ostrich
Speed 110 65 80 75 70 95
(km/h)
The frequency table shows the maximum speed, in km/h, of several animals.
(a) Represent the above data in a
(i) bar chart,
(ii) stem-and-leaf plot.
(b) Between the two types of data representations constructed in (a), which
representation is more suitable? Explain your answer.
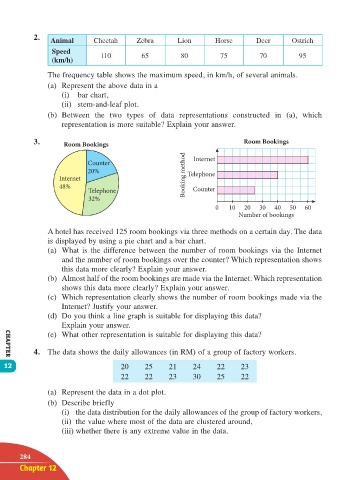
3. Room Bookings Room Bookings
Counter Internet
20% Telephone
Internet Booking method
48%
Telephone Counter
32%
0 10 20 30 40 50 60
Number of bookings
A hotel has received 125 room bookings via three methods on a certain day. The data
is displayed by using a pie chart and a bar chart.
(a) What is the difference between the number of room bookings via the Internet
and the number of room bookings over the counter? Which representation shows
this data more clearly? Explain your answer.
(b) Almost half of the room bookings are made via the Internet. Which representation
shows this data more clearly? Explain your answer.
(c) Which representation clearly shows the number of room bookings made via the
Internet? Justify your answer.
(d) Do you think a line graph is suitable for displaying this data?
Explain your answer.
(e) What other representation is suitable for displaying this data?
4. The data shows the daily allowances (in RM) of a group of factory workers.
CHAPTER
12 20 25 21 24 22 23
22 22 23 30 25 22
(a) Represent the data in a dot plot.
(b) Describe briefly
(i) the data distribution for the daily allowances of the group of factory workers,
(ii) the value where most of the data are clustered around,
(iii) whether there is any extreme value in the data.
284
Chapter 12
12 TB Math F1.indd 284 11/10/16 12:21 PM