Page 300 - C:\Users\azizu\Documents\Flip PDF Professional\Matematics-Form-1-1\
P. 300

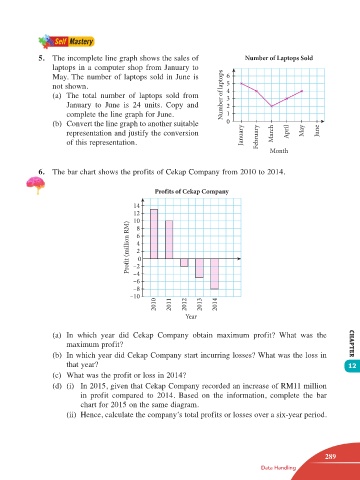
5.  The incomplete line graph shows the sales of              Number of Laptops Sold
                     laptops in a computer shop from January to
                     May. The number of laptops sold in June is          6
                     not shown.                                          5
                                                                         4
                     (a)  The  total  number  of  laptops  sold  from   Number of laptops  3
                         January to June is 24 units. Copy and           2
                         complete the line graph for June.               1
                     (b)  Convert the line graph to another suitable     0
                         representation and justify the conversion            January  February  March  April  May  June
                         of this representation.                                      Month


                 6.  The bar chart shows the profits of Cekap Company from 2010 to 2014.


                                                    Prof its of Cekap Company
                                             14
                                             12
                                             10 8
                                            Prof t (million RM)  i  6 4 2 0


                                             –2
                                             –4
                                             –6
                                             –8
                                            –10
                                                    2010  2011  2012  2013  2014

                                                             Year

                     (a)  In which year did Cekap Company  obtain  maximum  profit?  What  was the
                         maximum profit?                                                                      CHAPTER
                     (b)  In which year did Cekap Company start incurring losses? What was the loss in
                         that year?                                                                           12
                     (c)  What was the profit or loss in 2014?
                     (d)  (i)  In 2015, given that Cekap Company recorded an increase of RM11 million
                             in profit  compared to 2014. Based on the information, complete  the bar
                             chart for 2015 on the same diagram.
                         (ii)  Hence, calculate the company’s total profits or losses over a six-year period.


                                                                                                       289
                                                                                   Data Handling


       12 TB Math F1.indd   289                                                                       11/10/16   12:21 PM
   295   296   297   298   299   300   301   302   303   304   305