
Page 298 - C:\Users\azizu\Documents\Flip PDF Professional\Matematics-Form-1-1\
P. 298
Very Work
good harder
generate statistical questions and collect relevant data.
classify data as categorical or numerical and construct frequency tables.
construct data representation for ungrouped data and justify the appropriateness
of a data representation.
convert a data representation to other suitable data representations
with justification.
interpret various data representations including making inferences or predictions.
discuss the importance of representing data ethically in order to avoid confusion.
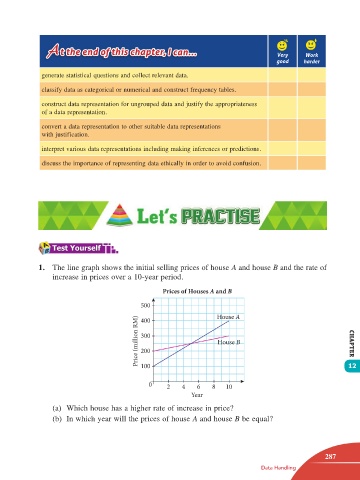
1. The line graph shows the initial selling prices of house A and house B and the rate of
increase in prices over a 10-year period.
Prices of Houses A and B
500
House A
400
Price (million RM) 300 House B CHAPTER
200
100
0 2 4 6 8 10 12
Year
(a) Which house has a higher rate of increase in price?
(b) In which year will the prices of house A and house B be equal?
287
Data Handling
12 TB Math F1.indd 287 11/10/16 12:21 PM