
Page 291 - C:\Users\azizu\Documents\Flip PDF Professional\Matematics-Form-1-1\
P. 291
14
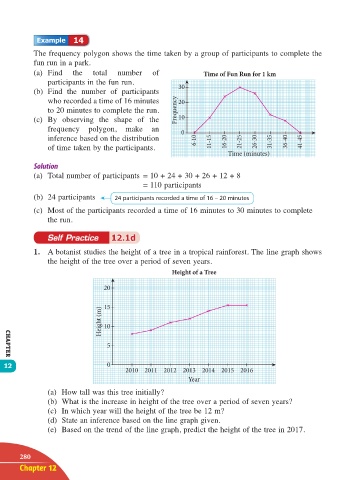
The frequency polygon shows the time taken by a group of participants to complete the
fun run in a park.
(a) Find the total number of Time of Fun Run for 1 km
participants in the fun run.
(b) Find the number of participants 30
who recorded a time of 16 minutes 20
to 20 minutes to complete the run. Frequency
(c) By observing the shape of the 10
frequency polygon, make an 0
inference based on the distribution 6-10 11-15 16-20 21-25 26-30 31-35 36-40 41-45
of time taken by the participants.
Time (minutes)
(a) Total number of participants = 10 + 24 + 30 + 26 + 12 + 8
= 110 participants
(b) 24 participants 24 participants recorded a time of 16 – 20 minutes
(c) Most of the participants recorded a time of 16 minutes to 30 minutes to complete
the run.
Self Practice 12.1d
1. A botanist studies the height of a tree in a tropical rainforest. The line graph shows
the height of the tree over a period of seven years.
Height of a Tree
20
15
Height (m) 10
5
CHAPTER
12 0
2010 2011 2012 2013 2014 2015 2016
Year
(a) How tall was this tree initially?
(b) What is the increase in height of the tree over a period of seven years?
(c) In which year will the height of the tree be 12 m?
(d) State an inference based on the line graph given.
(e) Based on the trend of the line graph, predict the height of the tree in 2017.
280
Chapter 12
12 TB Math F1.indd 280 11/10/16 12:21 PM