
Page 292 - C:\Users\azizu\Documents\Flip PDF Professional\Matematics-Form-1-1\
P. 292
2. The stem-and-leaf plot shows the diameters of axles manufactured by a machine.
Diameters of Axles
Stem Leaf
24 5 6 6 8
25 0 1 1 2 3 6
26 0 0 0 1 3 3 4 5 8 9
27 3 4 4 5 7 8 8
28 2 3 6
Key: 24 | 5 means 24.5 mm.
(a) Determine the total number of axles manufactured.
(b) Find the largest and the smallest diameters of the axles manufactured.
(c) A mechanic notices that he has to reduce the axles with diameters exceeding
27.5 mm so that the axles can fit into wheels. Calculate the percentage of axles
that need to have their diameters reduced.
(d) State an inference based on the distribution of the diameters of axles in this
stem-and-leaf plot.
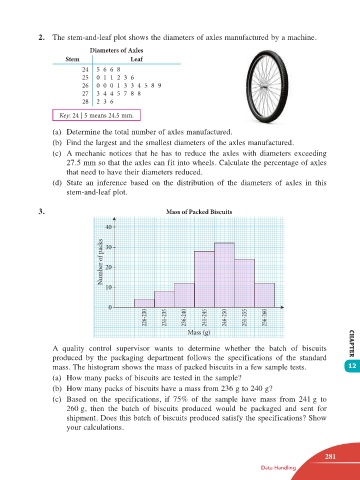
3. Mass of Packed Biscuits
40
Number of packs 30
20
10
0
226-230 231-235 236-240 241-245 246-250 251-255 256-260
Mass (g)
A quality control supervisor wants to determine whether the batch of biscuits CHAPTER
produced by the packaging department follows the specifications of the standard
mass. The histogram shows the mass of packed biscuits in a few sample tests. 12
(a) How many packs of biscuits are tested in the sample?
(b) How many packs of biscuits have a mass from 236 g to 240 g?
(c) Based on the specifications, if 75% of the sample have mass from 241 g to
260 g, then the batch of biscuits produced would be packaged and sent for
shipment. Does this batch of biscuits produced satisfy the specifications? Show
your calculations.
281
Data Handling
12 TB Math F1.indd 281 11/10/16 12:21 PM