
Page 285 - C:\Users\azizu\Documents\Flip PDF Professional\Matematics-Form-1-1\
P. 285
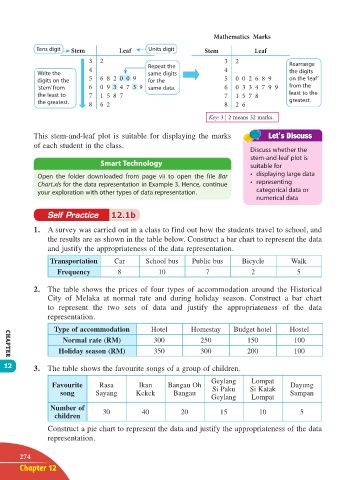
Mathematics  Marks

                Tens digit  Stem         Leaf     Units digit      Stem          Leaf
                                3  2                                    3   2               Rearrange
                                4                 Repeat the            4                   the digits
                Write the                         same digits
                digits on the   5  6  8  2  0  0  9  for the            5   0  0  2  6  8  9  on the ‘leaf’
                ‘stem’ from     6  0  9  3  4  7  3  9 same data.       6   0  3   3  4  7  9  9  from the
                the least to    7  1  5  8  7                           7   1  5  7  8      least to the
                the greatest.   8  6  2                                 8   2  6            greatest.

                                                                    Key: 3 | 2 means 32 marks.

               This stem-and-leaf plot is suitable for displaying the marks
               of each student in the class.
                                                                                Discuss whether the
                                                                                stem-and-leaf plot is
                                                                                suitable for
                Open  the  folder  downloaded  from  page  vii  to  open  the  file  Bar   •  displaying large data
                Chart.xls for the data representation in Example 3. Hence, continue   •  representing
                your exploration with other types of data representation.         categorical data or
                                                                                  numerical data

                   Self Practice       12.1b

               1.  A survey was carried out in a class to find out how the students travel to school, and
                   the results are as shown in the table below. Construct a bar chart to represent the data
                   and justify the appropriateness of the data representation.

                    Transportation     Car       School bus    Public bus     Bicycle       Walk
                      Frequency         8            10            7             2            5

               2.  The  table shows the prices  of four types of accommodation  around the Historical
                   City  of  Melaka  at  normal  rate  and  during  holiday  season.  Construct  a  bar  chart
                   to represent the two sets of data and  justify the appropriateness of the data
                   representation.

                     Type of accommodation        Hotel       Homestay     Budget hotel     Hostel
                        Normal rate (RM)           300           250           150           100
                       Holiday season (RM)         350           300           200           100
       CHAPTER
      12       3.  The table shows the favourite songs of a group of children.

                                                                     Geylang     Lompat
                     Favourite     Rasa        Ikan    Bangau Oh                            Dayung
                       song       Sayang      Kekek      Bangau      Si Paku    Si Katak    Sampan
                                                                     Geylang     Lompat
                    Number of       30          40         20          15          10          5
                     children
                   Construct a pie chart to represent the data and justify the appropriateness of the data
                   representation.

           274
           Chapter 12


       12 TB Math F1.indd   274                                                                       11/10/16   12:21 PM