Page 280 - C:\Users\azizu\Documents\Flip PDF Professional\Matematics-Form-1-1\
P. 280

3

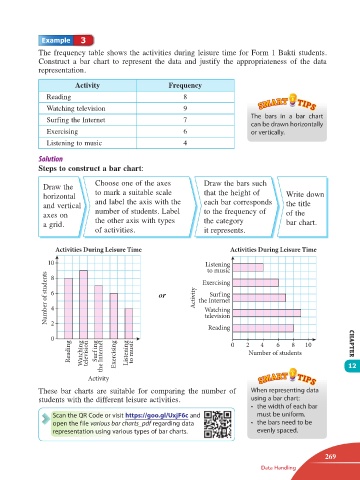
                 The frequency table shows the activities during leisure time for Form 1 Bakti students.
                 Construct  a  bar  chart  to  represent  the  data  and  justify  the  appropriateness  of  the  data
                 representation.

                            Activity                    Frequency
                   Reading                                  8
                   Watching television                      9
                                                                                The  bars  in  a  bar  chart
                   Surfing the Internet                     7
                                                                                can be drawn horizontally
                   Exercising                               6                   or vertically.
                   Listening to music                       4


                 Steps to construct a bar chart:

                                  Choose one of the axes          Draw the bars such
                  Draw the
                  horizontal      to mark a suitable scale        that the height of       Write down
                  and vertical    and label the axis with the     each bar corresponds     the title
                  axes on         number of students. Label       to the frequency of      of the
                  a grid.         the other axis with types       the category             bar chart.
                                  of activities.                  it represents.

                      Activities During Leisure Time                      Activities During Leisure Time

                   10                                              Listening
                                                                   to music
                   Number of students  6             or         Activity  the Internet
                    8
                                                                  Exercising
                                                                    Surf ing
                    4
                                                                   Watching
                                                                   television
                    2
                                                                    Reading
                    0                                                     0    2   4    6    8   10           CHAPTER
                          Reading  Watching  television  Surf ing  the Internet  Exercising  Listening  to music   Number of students


                                Activity                                                                      12

                 These  bar  charts are suitable  for comparing  the  number  of   When representing data
                 students with the different leisure activities.                using a bar chart:
                                                                                •  the width of each bar
                      Scan the QR Code or visit https://goo.gl/UxjF6c and         must be uniform.
                     open the file various bar charts_pdf regarding data        •  the bars need to be
                     representation using various types of bar charts.            evenly spaced.


                                                                                                       269
                                                                                   Data Handling


       12 TB Math F1.indd   269                                                                       11/10/16   12:21 PM
   275   276   277   278   279   280   281   282   283   284   285