
Page 281 - C:\Users\azizu\Documents\Flip PDF Professional\Matematics-Form-1-1\
P. 281
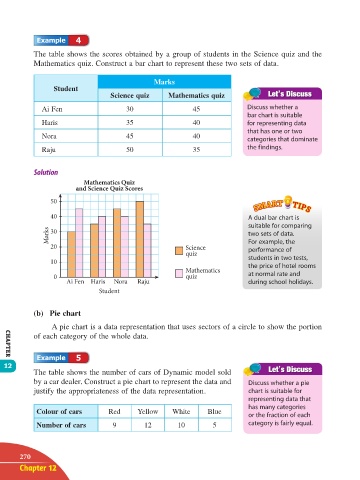
4

               The table shows the scores obtained by a group of students in the Science quiz and the
               Mathematics quiz. Construct a bar chart to represent these two sets of data.

                                                   Marks
                     Student
                                      Science quiz      Mathematics quiz
                  Ai Fen                   30                  45              Discuss whether a
                                                                               bar chart is suitable
                  Haris                    35                  40              for representing data
                                                                               that has one or two
                  Nora                     45                  40              categories that dominate
                                                                               the findings.
                  Raju                     50                  35


                              Mathematics Quiz
                            and Science Quiz Scores
                    50

                    40                                                          A dual bar chart is
                                                                                suitable for comparing
                    Marks  30                                                   two sets of data.

                    20                                       Science            For example, the
                                                                                performance of
                                                             quiz
                    10                                                          students in two tests,
                                                                                the price of hotel rooms
                                                             Mathematics
                     0                                       quiz               at normal rate and
                         Ai Fen Haris  Nora   Raju                              during school holidays.
                                   Student


               (b)  Pie chart

                     A pie chart is a data representation that uses sectors of a circle to show the portion
               of each category of the whole data.

                            5
       CHAPTER
      12
               The table shows the number of cars of Dynamic model sold
               by a car dealer. Construct a pie chart to represent the data and   Discuss whether a pie
               justify the appropriateness of the data representation.          chart is suitable for
                                                                                representing data that
                                                                                has many categories
                Colour of cars        Red     Yellow     White     Blue
                                                                                or the fraction of each
                Number of cars         9        12        10         5          category is fairly equal.


           270
           Chapter 12


       12 TB Math F1.indd   270                                                                       11/10/16   12:21 PM