
Page 276 - C:\Users\azizu\Documents\Flip PDF Professional\Matematics-Form-1-1\
P. 276
In ancient times, statistics
were used by rulers to
gather information about
the population during their
reign. However, statistics
were only recorded in printed
form in the 18th century by
an English statistician, John John Graunt
Graunt. Two other English
statisticians who actively contributed to
the early development of statistics were
Karl Pearson (1857 – 1936) and Ronald
Fisher (1890 – 1962).
For more information:
http://goo.gl/Nx43ay
Word Link
• pie chart • carta pai
• bar chart • carta palang
• categorical data • data kategori
• numerical data • data numerik
• line graph • graf garis
• histogram • histogram
• frequency table • jadual kekerapan
• displaying data • memaparkan data
• analysing data • menganalisis data
• classifying data • mengklasifikasikan data CHAPTER
• organising data • mengorganisasikan data
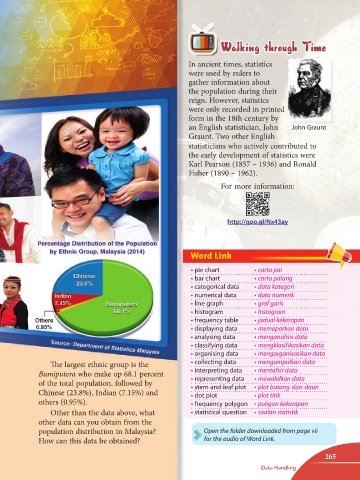
The largest ethnic group is the • collecting data • mengumpulkan data 12
Bumiputera who make up 68.1 percent • interpreting data • mentafsir data
• representing data
• mewakilkan data
of the total population, followed by • stem-and-leaf plot • plot batang-dan-daun
Chinese (23.8%), Indian (7.15%) and • dot plot • plot titik
others (0.95%). • frequency polygon • poligon kekerapan
Other than the data above, what • statistical question • soalan statistik
other data can you obtain from the
population distribution in Malaysia? Open the folder downloaded from page vii
How can this data be obtained? for the audio of Word Link.
265
265
Data Handling
Data Handling
12 TB Math F1.indd 265 11/10/16 12:21 PM