
Page 279 - C:\Users\azizu\Documents\Flip PDF Professional\Matematics-Form-1-1\
P. 279
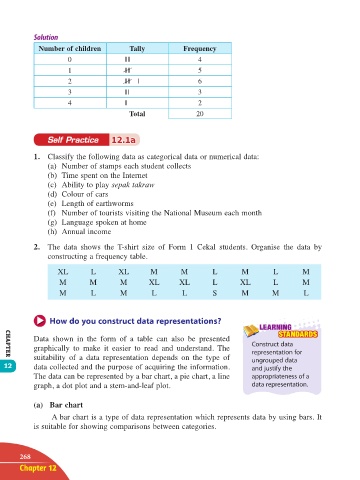
Number of children         Tally           Frequency
                          0                ||||                  4
                          1                ||||                  5
                          2                ||||  |               6
                          3                |||                   3
                          4                ||                    2
                                            Total               20


                   Self Practice       12.1a

               1.  Classify the following data as categorical data or numerical data:
                   (a)  Number of stamps each student collects
                   (b)  Time spent on the Internet
                   (c)  Ability to play sepak takraw
                   (d)  Colour of cars
                   (e)  Length of earthworms
                   (f)  Number of tourists visiting the National Museum each month
                   (g)  Language spoken at home
                   (h)  Annual income

               2.  The data shows  the  T-shirt size of Form 1 Cekal students. Organise the data  by
                   constructing a frequency table.

                      XL        L        XL       M        M         L        M        L        M
                       M        M        M        XL       XL        L       XL        L        M
                       M        L        M         L        L        S        M        M        L


                     How do you construct data representations?
                                                                                   LEARNING
                                                                                         STANDARDS
               Data  shown  in the form of a table can also be presented         Construct data
               graphically  to  make  it  easier  to  read  and  understand.  The   representation for
               suitability  of a data  representation  depends  on the  type of   ungrouped data
       CHAPTER
      12       data collected and the purpose of acquiring the information.      and justify the
               The data can be represented by a bar chart, a pie chart, a line   appropriateness of a
               graph, a dot plot and a stem-and-leaf plot.                       data representation.


               (a)  Bar chart
                     A bar chart is a type of data representation which represents data by using bars. It
               is suitable for showing comparisons between categories.


           268
           Chapter 12


       12 TB Math F1.indd   268                                                                       11/10/16   12:21 PM