
Page 278 - C:\Users\azizu\Documents\Flip PDF Professional\Matematics-Form-1-1\
P. 278
Have a discussion with your friends about choosing the most suitable method to collect data. State
the advantages and disadvantages of each method by giving examples to support your answers.
How do you classify data and construct
frequency tables? LEARNING
STANDARDS
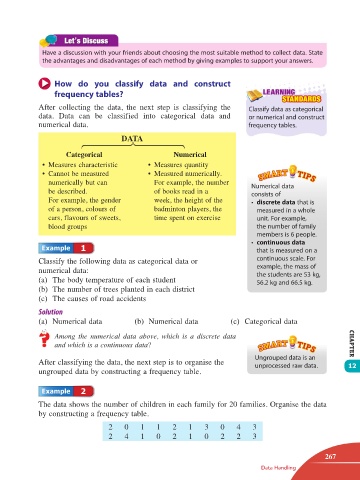
After collecting the data, the next step is classifying the Classify data as categorical
data. Data can be classified into categorical data and or numerical and construct
numerical data. frequency tables.
DATA
Categorical Numerical
• Measures characteristic • Measures quantity
• Cannot be measured • Measured numerically.
numerically but can For example, the number Numerical data
be described. of books read in a consists of
For example, the gender week, the height of the • discrete data that is
of a person, colours of badminton players, the measured in a whole
cars, flavours of sweets, time spent on exercise unit. For example,
blood groups the number of family
members is 6 people.
• continuous data
1 that is measured on a
Classify the following data as categorical data or continuous scale. For
example, the mass of
numerical data: the students are 53 kg,
(a) The body temperature of each student 56.2 kg and 66.5 kg.
(b) The number of trees planted in each district
(c) The causes of road accidents
(a) Numerical data (b) Numerical data (c) Categorical data
Among the numerical data above, which is a discrete data
and which is a continuous data? CHAPTER
Ungrouped data is an
After classifying the data, the next step is to organise the unprocessed raw data. 12
ungrouped data by constructing a frequency table.
2
The data shows the number of children in each family for 20 families. Organise the data
by constructing a frequency table.
2 0 1 1 2 1 3 0 4 3
2 4 1 0 2 1 0 2 2 3
267
Data Handling
12 TB Math F1.indd 267 11/10/16 12:21 PM