
Page 284 - C:\Users\azizu\Documents\Flip PDF Professional\Matematics-Form-1-1\
P. 284
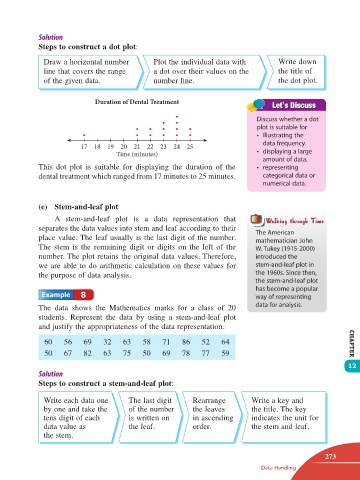
Steps to construct a dot plot:

                  Draw a horizontal number         Plot the individual data with         Write down
                  line that covers the range       a dot over their values on the        the title of
                  of the given data.               number line.                          the dot plot.


                                  Duration of Dental Treatment

                                                                                  Discuss whether a dot
                                                                                  plot is suitable for
                                                                                  •  illustrating the
                             17  18  19  20  21  22  23  24  25                     data frequency.
                                        Time (minutes)                            •  displaying a large
                                                                                    amount of data.
                 This  dot  plot  is suitable  for displaying  the  duration  of the   •  representing
                 dental treatment which ranged from 17 minutes to 25 minutes.       categorical data or
                                                                                    numerical data.


                 (e)  Stem-and-leaf plot

                      A stem-and-leaf plot is a data representation that
                 separates the data values into stem and leaf according to their   The American
                 place value. The leaf usually is the last digit of the number.   mathematician John
                 The stem is the remaining digit or digits on the left of the     W. Tukey (1915-2000)
                 number. The plot retains the original data values. Therefore,    introduced the
                 we are able to do arithmetic calculation on these values for     stem-and-leaf plot in
                 the purpose of data analysis.                                    the 1960s. Since then,
                                                                                  the stem-and-leaf plot
                                                                                  has become a popular
                             8                                                    way of representing

                 The  data  shows  the  Mathematics  marks  for  a  class  of  20   data for analysis.
                 students.  Represent  the  data  by using a  stem-and-leaf plot
                 and justify the appropriateness of the data representation.

                  60    56    69    32    63    58    71    86    52    64                                    CHAPTER
                  50    67    82    63    75    50    69    78    77    59
                                                                                                              12

                 Steps to construct a stem-and-leaf plot:

                  Write each data one       The last digit     Rearrange         Write a key and
                  by one and take the       of the number      the leaves        the title. The key
                  tens digit of each        is written on      in ascending      indicates the unit for
                  data value as             the leaf.          order.            the stem and leaf.
                  the stem.


                                                                                                       273
                                                                                   Data Handling


       12 TB Math F1.indd   273                                                                       11/10/16   12:21 PM