
Page 10 - 2018 Apple Annual Report
P. 10
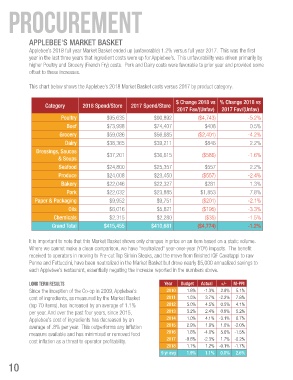
PROCUREMENT


             APPLEBEE'S MARKET BASKET
             Applebee’s 2018 full year Market Basket ended up (unfavorable) 1.2% versus full year 2017.  This was the first
             year in the last three years that ingredient costs were up for Applebee’s.  This unfavorability was driven primarily by
             higher Poultry and Grocery (French Fry) costs.  Pork and Dairy costs were favorable to prior year and provided some
             offset to these increases.


             This chart below shows the Applebee’s 2018 Market Basket costs versus 2017 by product category.


                                                                           $ Change 2018 vs  % Change 2018 vs
                    Category        2018 Spend/Store    2017 Spend/Store
                                                                           2017 Fav/(Unfav)   2017 Fav/(Unfav)
                           Poultry            $95,635             $90,892           ($4,743)             -5.2%
                             Beef             $73,998             $74,407              $408              0.5%
                          Grocery             $59,086             $56,685           ($2,401)             -4.2%
                            Dairy             $38,365            $39,211               $846              2.2%
                Dressings, Sauces
                         & Soups              $37,201            $36,615             ($586)              -1.6%

                          Seafood             $24,800            $25,357               $557              2.2%
                         Produce              $24,008            $23,450             ($557)              -2.4%
                           Bakery             $22,046            $22,327               $281              1.3%
                             Pork             $22,032            $23,885             $1,853              7.8%
                Paper & Packaging              $9,952              $9,751            ($201)              -2.1%

                              Oils             $6,016              $5,821            ($195)              -3.3%
                       Chemicals               $2,315              $2,280              ($35)             -1.5%
                       Grand Total          $415,455            $410,681            ($4,774)             -1.2%


             It is important to note that this Market Basket shows only changes in price on an item based on a static volume.
             Where we cannot make a clean comparison, we have “neutralized” year-over-year (YOY) impacts.  The benefit
             received to operators in moving to Pre-cut Top Sirloin Steaks, and the move from finished IQF Cavatappi to raw
             Penne and Fettuccini, have been neutralized in the Market Basket but drove nearly $5,000 annualized savings to
             each Applebee’s restaurant, essentially negating the increase reported in the numbers above.

             LONG TERM RESULTS                                        Year   Budget  Actual  +/-   M-PPI
             Since the inception of the Co-op in 2009, Applebee’s      2010    1.6%   -1.3%  2.9%   5.1%
             cost of ingredients, as measured by the Market Basket     2011    1.5%    3.7% -2.2%   7.8%
             (top 70 items), has increased by an average of 1.1%       2012    5.0%    4.5%  0.5%   4.1%
             per year. And over the past four years, since 2015,       2013    3.2%    2.4%  0.8%   5.2%
             Applebee’s cost of ingredients has decreased by an        2014    1.0%    4.1% -3.1%   6.7%
             average of .8% per year.  This outperforms any inflation   2015   2.9%    1.9%  1.0% -2.0%
             measure available and has minimized or removed food       2016    1.6%   -4.0%  5.6% -1.5%
             cost inflation as a threat to operator profitability.     2017   -0.6%   -2.3%  1.7% -0.2%
                                                                       2018    1.1%    1.2% -0.1% -1.7%
                                                                    9 yr avg   1.9%    1.1%  0.8%   2.6%

     10