
Page 121 - New Employee Onboarding
P. 121
Confidential and Privileged
For the Audit and Finance Committee's Review
Work-paper #3-2:
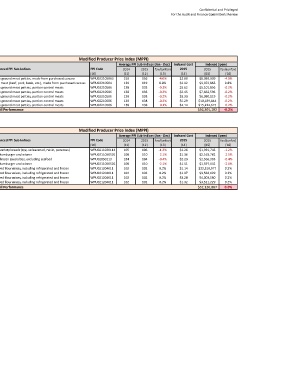
Pancake Market Basket vs. Modified Producer Price Index:
2015 Performance by Category
Category: Beef
Pancake Market Basket Modified Producer Price Index (MPPI)
Average Actual Store Cost (Jan - Dec) Budgeted Spend Average PPI Sub-Indices (Jan - Dec) Indexed Cost Indexed Spend
Product 2014 2015 fav/(unfav) Volume 2015 2014 2015 fav/(unfav) Referenced PPI Sub-Indices PPI Code 2014 2015 fav/(unfav) 2015 2015 fav/(unfav)
[1] [2] [3] [4] [5] [6] [7] [8] [9] [10] [11] [12] [13] [14] [15] [16]
Beef, Ground, Patty, 6 oz $2.59 $2.57 0.8% 2,995,960 $7,750,489 $7,685,435 0.8% Frozen ground meat patties, made from purchased carcass WPU022105863 150 156 -4.0% $2.69 $8,059,009 -4.0%
Beef, Pot Roast, Sweet Onion $3.31 $3.63 -9.5% 1,018,160 $3,370,378 $3,691,028 -9.5% Boxed meat (beef, pork, lamb, etc.), made from purchased carcass WPU02210504 130 119 8.8% $3.02 $3,072,865 8.8%
Beef, Sirloin Flat Steak, Steak-EZE, Marinated $3.61 $4.68 -29.7% 1,411,020 $5,091,075 $6,604,560 -29.7% Frozen ground meat patties, portion control meats WPU02210586 138 138 -0.2% $3.62 $5,101,856 -0.2%
Beef, Steak Fritters, 8 oz, 35/cs $2.44 $3.35 -37.1% 3,133,208 $7,647,398 $10,488,221 -37.1% Frozen ground meat patties, portion control meats WPU02210586 138 138 -0.2% $2.45 $7,663,593 -0.2%
Steak, Omelet Strips, 4 oz $3.33 $3.56 -6.9% 2,096,755 $6,975,347 $7,456,014 -6.9% Frozen ground meat patties, portion control meats WPU02210586 138 138 -0.2% $3.33 $6,990,119 -0.2%
Steak, T-Bone, 12 oz $5.28 $6.29 -19.1% 1,926,083 $10,167,511 $12,109,583 -19.1% Frozen ground meat patties, portion control meats WPU02210586 138 138 -0.2% $5.29 $10,189,044 -0.2%
Steak, Tips, 8 oz, Beef Seasoned Sirloin Cubes $4.13 $4.51 -9.2% 3,678,528 $15,192,442 $16,587,109 -9.2% Frozen ground meat patties, portion control meats WPU02210586 138 138 -0.2% $4.14 $15,224,615 -0.2%
Overall Performance $56,194,640 $64,621,951 -15.0% Overall Performance $56,301,102 -0.2%
Category: Bakery
Pancake Market Basket Modified Producer Price Index (MPPI)
Average Actual Store Cost (Jan - Dec) Budgeted Spend Average PPI Sub-Indices (Jan - Dec) Indexed Cost Indexed Spend
Product 2014 2015 fav/(unfav) Volume 2015 2014 2015 fav/(unfav) Referenced PPI Sub-Indices PPI Code 2014 2015 fav/(unfav) 2015 2015 fav/(unfav)
[1] [2] [3] [4] [5] [6] [7] [8] [9] [10] [11] [12] [13] [14] [15] [16]
Bread, Garlic Toast-New York Frozen Foods $1.25 $1.24 0.6% 1,103,594 $1,374,848 $1,366,475 0.6% Other variety breads (rye, unleavened, raisin, potatoes) WPU0211020114 105 106 -1.2% $1.26 $1,391,743 -1.2%
Bun, Butter 4.5" $1.33 $1.31 1.6% 1,593,540 $2,119,720 $2,086,508 1.6% Rolls, hamburger and wiener WPU0211050501 108 110 -2.1% $1.36 $2,163,782 -2.1%
French Toast, Stuffed, Original, ZTF $2.22 $2.25 -1.5% 1,151,886 $2,555,862 $2,594,074 -1.5% Other frozen specialties, excluding seafood WPU02850113 184 184 -0.4% $2.23 $2,566,305 -0.4%
Hoagie Roll, Soft $1.48 $1.46 1.6% 1,058,601 $1,564,619 $1,540,363 1.6% Rolls, hamburger and wiener WPU0211050501 108 110 -2.1% $1.51 $1,597,142 -2.1%
Pancake Mix, Buttermilk $1.14 $1.13 0.7% 29,314,492 $33,384,196 $33,161,365 0.7% Prepared flour mixes, including refrigerated and frozen WPU021204011 102 102 0.2% $1.14 $33,318,977 0.2%
Pancake Mix, Egg Batter $1.08 $1.09 -1.3% 3,321,500 $3,571,106 $3,616,129 -1.3% Prepared flour mixes, including refrigerated and frozen WPU021204011 102 102 0.2% $1.07 $3,564,129 0.2%
Pancake Mix, Harvest Grain N' Nut $3.29 $3.30 -0.4% 1,218,895 $4,011,416 $4,025,513 -0.4% Prepared flour mixes, including refrigerated and frozen WPU021204011 102 102 0.2% $3.28 $4,003,580 0.2%
Waffle Mix, Golden Belgian $1.33 $1.31 1.3% 2,661,853 $3,528,122 $3,482,759 1.3% Prepared flour mixes, including refrigerated and frozen WPU021204011 102 102 0.2% $1.32 $3,521,229 0.2%
Overall Performance $52,109,888 $51,873,187 0.5% Overall Performance $52,126,887 0.0%
Sources & Notes:
[1]: Products are based on Pancake Price Index.
[2]: Average actual store cost for 2014 is calculated by taking the average of prices from January 2014 through December 2014.
[3]: Average actual store cost for 2015 is calculated by taking the average of prices from January 2015 through December 2015.
[4]: Change in average actual store cost= -{[3] - [2]}/[2].
[5]: Budgeted volumes for 2015 are based on Pancake Price Index.
[6]: [2] x [5].
[7]: [3] x [5].
[8]: -{[7] - [6]}/[6]. Notice that [4] & [8] have the same results.
[9]: PPI sub-indices are selected based on resemblance with products in Pancake Market Basket.
[10]: See PPI Codes on the Bureau of Labor Statistics: http://www.bls.gov/news.release/pdf/ppi.pdf
[11]: Data were retrieved from the Bureau of Labor Statistic website: http://data.bls.gov/cgi-bin/srgate
[12]: Data were retrieved from the Bureau of Labor Statistic website: http://data.bls.gov/cgi-bin/srgate
[13]: Change in PPI sub-indices = -{[12] - [11]}/[11].
[14]: [2] x {1 - [13]}.
[15]: [5] x [14].
[16]: -{[15] - [6]}/[6]. Notice that [13] & [16] have the same results.