
Page 124 - New Employee Onboarding
P. 124
Confidential and Privileged
For the Audit and Finance Committee's Review
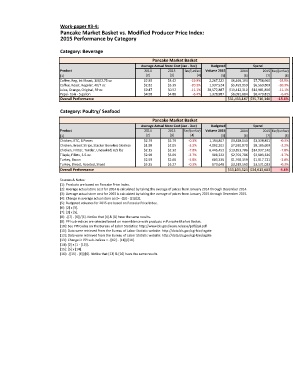
Work-paper #3-4:
Pancake Market Basket vs. Modified Producer Price Index:
2015 Performance by Category
Category: Beverage
Pancake Market Basket Modified Producer Price Index (MPPI)
Average Actual Store Cost (Jan - Dec) Budgeted Spend Average PPI Sub-Indices (Jan - Dec) Indexed Cost Indexed Spend
Product 2014 2015 fav/(unfav) Volume 2015 2014 2015 fav/(unfav) Referenced PPI Sub-Indices PPI Code 2014 2015 fav/(unfav) 2015 2015 fav/(unfav)
[1] [2] [3] [4] [5] [6] [7] [8] [9] [10] [11] [12] [13] [14] [15] [16]
Coffee, Reg, Intl Roast, 100/2.75 oz $2.85 $3.42 -19.9% 2,267,222 $6,469,194 $7,758,660 -19.9% Roasted coffee WPU02630104 175 181 -3.0% $2.94 $6,665,501 -3.0%
Coffee, Roast, Regular, 40/7 oz $2.82 $3.39 -20.3% 1,937,524 $5,459,959 $6,569,809 -20.3% Roasted coffee WPU02630104 175 181 -3.0% $2.90 $5,625,641 -3.0%
Juice, Orange, Original, 59 oz $0.47 $0.52 -11.1% 28,572,887 $13,412,310 $14,901,856 -11.1% Frozen concentrated orange juice, consumer and inst WPU02420301 172 176 -2.5% $0.48 $13,753,482 -2.5%
Pepsi- Cola - 5 gallon $4.58 $4.88 -6.4% 1,328,987 $6,091,684 $6,479,815 -6.4% Liquid beverage bases, excluding use by soft drink WPU02640109 182 182 0.1% $4.58 $6,088,615 0.1%
Overall Performance $31,433,147 $35,710,140 -13.6% Overall Performance $32,133,239 -2.2%
Category: Poultry/ Seafood
Pancake Market Basket Modified Producer Price Index (MPPI)
Average Actual Store Cost (Jan - Dec) Budgeted Spend Average PPI Sub-Indices (Jan - Dec) Indexed Cost Indexed Spend
Product 2014 2015 fav/(unfav) Volume 2015 2014 2015 fav/(unfav) Referenced PPI Sub-Indices PPI Code 2014 2015 fav/(unfav) 2015 2015 fav/(unfav)
[1] [2] [3] [4] [5] [6] [7] [8] [9] [10] [11] [12] [13] [14] [15] [16]
Chicken, RTC, 8 Pieces $2.79 $2.79 -0.3% 1,194,807 $3,328,043 $3,338,851 -0.3% Canned, cooked, smoked or prepared poultry WPU02220811 127 128 -1.3% $2.82 $3,372,023 -1.3%
Chicken, Breast Strips, Stacker Boneless Skinless $1.98 $2.05 -3.2% 4,002,203 $7,930,870 $8,185,609 -3.2% Canned, cooked, smoked or prepared poultry WPU02220811 127 128 -1.3% $2.01 $8,035,676 -1.3%
Chicken, Fritter, Tender, Uncooked, 6/5 lbs $2.15 $2.32 -7.8% 6,445,453 $13,853,706 $14,937,142 -7.8% Canned, cooked, smoked or prepared poultry WPU02220811 127 128 -1.3% $2.18 $14,036,782 -1.3%
Tilapia, Fillets, 3-5 oz. $2.98 $3.09 -3.7% 908,222 $2,703,786 $2,803,326 -3.7% Prepared frozen fish WPU02230602 93 93 0.0% $2.98 $2,703,543 0.0%
Turkey, Bacon $2.59 $2.66 -2.8% 683,336 $1,768,359 $1,817,721 -2.8% Turkeys, including frozen, whole, and parts WPU02220611 169 163 3.8% $2.49 $1,701,653 3.8%
Turkey, Breast, Roasted, Sliced $5.25 $5.27 -0.3% 670,648 $3,519,560 $3,531,033 -0.3% Turkeys, including frozen, whole, and parts WPU02220611 169 163 3.8% $5.05 $3,386,796 3.8%
Overall Performance $33,104,324 $34,613,683 -4.6% Overall Performance $33,236,474 -0.4%
Sources & Notes:
[1]: Products are based on Pancake Price Index.
[2]: Average actual store cost for 2014 is calculated by taking the average of prices from January 2014 through December 2014.
[3]: Average actual store cost for 2015 is calculated by taking the average of prices from January 2015 through December 2015.
[4]: Change in average actual store cost= -{[3] - [2]}/[2].
[5]: Budgeted volumes for 2015 are based on Pancake Price Index.
[6]: [2] x [5].
[7]: [3] x [5].
[8]: -{[7] - [6]}/[6]. Notice that [4] & [8] have the same results.
[9]: PPI sub-indices are selected based on resemblance with products in Pancake Market Basket.
[10]: See PPI Codes on the Bureau of Labor Statistics: http://www.bls.gov/news.release/pdf/ppi.pdf
[11]: Data were retrieved from the Bureau of Labor Statistic website: http://data.bls.gov/cgi-bin/srgate
[12]: Data were retrieved from the Bureau of Labor Statistic website: http://data.bls.gov/cgi-bin/srgate
[13]: Change in PPI sub-indices = -{[12] - [11]}/[11].
[14]: [2] x {1 - [13]}.
[15]: [5] x [14].
[16]: -{[15] - [6]}/[6]. Notice that [13] & [16] have the same results.