
Page 122 - New Employee Onboarding
P. 122
Confidential and Privileged
For the Audit and Finance Committee's Review
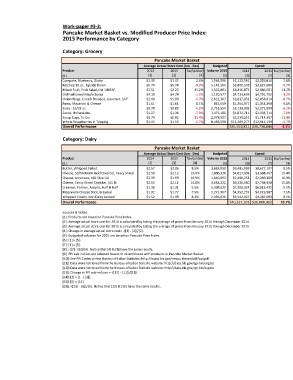
Work-paper #3-3:
Pancake Market Basket vs. Modified Producer Price Index:
2015 Performance by Category
Category: Grocery
Pancake Market Basket Modified Producer Price Index (MPPI)
Average Actual Store Cost (Jan - Dec) Budgeted Spend Average PPI Sub-Indices (Jan - Dec) Indexed Cost Indexed Spend
Product 2014 2015 fav/(unfav) Volume 2015 2014 2015 fav/(unfav) Referenced PPI Sub-Indices PPI Code 2014 2015 fav/(unfav) 2015 2015 fav/(unfav)
[1] [2] [3] [4] [5] [6] [7] [8] [9] [10] [11] [12] [13] [14] [15] [16]
Compote, Blueberry, Globe $1.35 $1.32 2.6% 1,564,596 $2,115,581 $2,059,810 2.6% Canned jams, jellies, and preserves WPU02810102 164 164 0.3% $1.35 $2,110,111 0.3%
Ketchup 20 oz., Upside Down $0.74 $0.74 -0.7% 5,143,200 $3,800,538 $3,827,680 -0.7% Canned catsup and other tomato based sauces WPU02440127 157 156 0.8% $0.73 $3,768,731 0.8%
Mixed Fruit, Fruit Salad, Del 14#FAF $2.51 $2.23 11.2% 1,322,881 $3,316,871 $2,946,081 11.2% Canned fruits, excluding baby foods WPU02410105 181 200 -10.0% $2.76 $3,649,152 -10.0%
Old Fashioned Maple Syrup $4.19 $4.24 -1.2% 1,130,577 $4,733,659 $4,791,792 -1.2% Corn sweeteners WPU02540107 172 167 2.8% $4.07 $4,599,449 2.8%
Onion Rings, Crumb Breaded, Gourmet, 3/4" $1.09 $1.09 -0.7% 2,612,307 $2,837,952 $2,858,814 -0.7% Frozen vegetables, other than potato products WPU02450509 135 136 -0.9% $1.10 $2,862,712 -0.9%
Pasta, Macaroni & Cheese $1.61 $1.61 0.1% 842,559 $1,354,977 $1,353,398 0.1% Dry macaroni, spaghetti, and egg noodle products WPU0214020303 112 120 -7.4% $1.73 $1,455,005 -7.4%
Salsa - 16/32 oz $0.78 $0.83 -6.2% 2,753,554 $2,139,005 $2,271,999 -6.2% Canned catsup and other tomato based sauces WPU02440127 157 156 0.8% $0.77 $2,121,104 0.8%
Sauce, Hollandaise $1.27 $1.36 -7.0% 1,475,180 $1,872,711 $2,003,714 -7.0% Prepared sauces, except tomato WPU02860103 157 158 -0.6% $1.28 $1,884,117 -0.6%
Syrup Cups, To Go $0.74 $0.82 -11.4% 2,078,507 $1,539,251 $1,714,397 -11.4% Corn sweeteners WPU02540107 172 167 2.8% $0.72 $1,495,609 2.8%
Whole Strawberries in Topping $1.45 $1.53 -5.7% 8,436,598 $12,209,277 $12,911,159 -5.7% Canned jams, jellies, and preserves WPU02810102 164 164 0.3% $1.44 $12,177,707 0.3%
Overall Performance $35,919,821 $36,738,844 -2.3% Overall Performance $36,123,698 -0.6%
Category: Dairy
Pancake Market Basket Modified Producer Price Index (MPPI)
Average Actual Store Cost (Jan - Dec) Budgeted Spend Average PPI Sub-Indices (Jan - Dec) Indexed Cost Indexed Spend
Product 2014 2015 fav/(unfav) Volume 2015 2014 2015 fav/(unfav) Referenced PPI Sub-Indices PPI Code 2014 2015 fav/(unfav) 2015 2015 fav/(unfav)
[1] [2] [3] [4] [5] [6] [7] [8] [9] [10] [11] [12] [13] [14] [15] [16]
Butter, Whipped Salted $2.57 $2.36 8.5% 3,683,950 $9,485,999 $8,677,197 8.5% Butter WPU02320114 151 148 2.4% $2.51 $9,262,135 2.4%
Cheese, 50/50 Mont Jack/Ched Col, Fancy Shred $2.50 $2.12 15.4% 1,606,326 $4,017,003 $3,398,467 15.4% Natural cheese, except lowfat, shipped in packages WPU023302122 108 86 20.0% $2.00 $3,213,167 20.0%
Cheese, American, 160 Slice Col $2.39 $1.99 16.9% 1,040,093 $2,490,253 $2,069,389 16.9% Natural cheese, except lowfat, shipped in packages WPU023302122 108 86 20.0% $1.92 $1,991,932 20.0%
Cheese, Fancy Shred Cheddar, 4/5 lb $2.52 $2.12 15.8% 3,663,222 $9,230,960 $7,768,938 15.8% Natural cheese, except lowfat, shipped in packages WPU023302122 108 86 20.0% $2.02 $7,383,767 20.0%
Creamer, Portion, Aseptic, Half & Half $1.38 $1.31 5.5% 5,208,632 $7,208,324 $6,813,432 5.5% Other fluid milk related products, packaged, incl. WPU02310304 231 222 4.1% $1.33 $6,910,262 4.1%
Mozzarella Cheese Stick, Breaded $1.92 $1.77 7.5% 2,271,907 $4,352,237 $4,025,987 7.5% Other frozen specialties, excluding seafood WPU02850113 184 184 -0.4% $1.92 $4,370,022 -0.4%
Whipped Cream, Non Dairy Aerosol $1.52 $1.39 8.3% 2,336,626 $3,542,327 $3,247,003 8.3% Other fluid milk related products, packaged, incl. WPU02310304 231 222 4.1% $1.45 $3,395,852 4.1%
Overall Performance $40,327,103 $36,000,412 10.7% Overall Performance $36,527,136 9.4%
Sources & Notes:
[1]: Products are based on Pancake Price Index.
[2]: Average actual store cost for 2014 is calculated by taking the average of prices from January 2014 through December 2014.
[3]: Average actual store cost for 2015 is calculated by taking the average of prices from January 2015 through December 2015.
[4]: Change in average actual store cost= -{[3] - [2]}/[2].
[5]: Budgeted volumes for 2015 are based on Pancake Price Index.
[6]: [2] x [5].
[7]: [3] x [5].
[8]: -{[7] - [6]}/[6]. Notice that [4] & [8] have the same results.
[9]: PPI sub-indices are selected based on resemblance with products in Pancake Market Basket.
[10]: See PPI Codes on the Bureau of Labor Statistics: http://www.bls.gov/news.release/pdf/ppi.pdf
[11]: Data were retrieved from the Bureau of Labor Statistic website: http://data.bls.gov/cgi-bin/srgate
[12]: Data were retrieved from the Bureau of Labor Statistic website: http://data.bls.gov/cgi-bin/srgate
[13]: Change in PPI sub-indices = -{[12] - [11]}/[11].
[14]: [2] x {1 - [13]}.
[15]: [5] x [14].
[16]: -{[15] - [6]}/[6]. Notice that [13] & [16] have the same results.