
Page 126 - New Employee Onboarding
P. 126
Confidential and Privileged
For the Audit and Finance Committee's Review
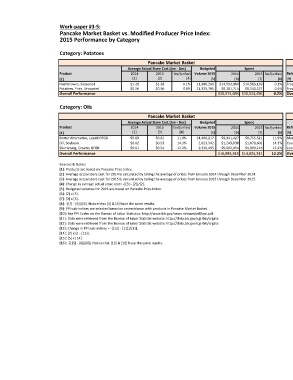
Work-paper #3-5:
Pancake Market Basket vs. Modified Producer Price Index:
2015 Performance by Category
Category: Potatoes
Pancake Market Basket Modified Producer Price Index (MPPI)
Average Actual Store Cost (Jan - Dec) Budgeted Spend Average PPI Sub-Indices (Jan - Dec) Indexed Cost Indexed Spend
Product 2014 2015 fav/(unfav) Volume 2015 2014 2015 fav/(unfav) Referenced PPI Sub-Indices PPI Code 2014 2015 fav/(unfav) 2015 2015 fav/(unfav)
[1] [2] [3] [4] [5] [6] [7] [8] [9] [10] [11] [12] [13] [14] [15] [16]
Hashbrowns, Seasoned $1.28 $1.28 0.1% 11,380,291 $14,592,980 $14,583,139 0.1% Frozen potato products (French-fried, patties, puff) WPU02450202 238 238 -0.2% $1.29 $14,627,234 -0.2%
Potatoes, Fries, Uncoated $0.56 $0.56 0.6% 11,325,781 $6,381,714 $6,340,357 0.6% Frozen potato products (French-fried, patties, puff) WPU02450202 238 238 -0.2% $0.56 $6,396,693 -0.2%
Overall Performance $20,974,694 $20,923,496 0.2% Overall Performance $21,023,927 -0.2%
Category: Oils
Pancake Market Basket Modified Producer Price Index (MPPI)
Average Actual Store Cost (Jan - Dec) Budgeted Spend Average PPI Sub-Indices (Jan - Dec) Indexed Cost Indexed Spend
Product 2014 2015 fav/(unfav) Volume 2015 2014 2015 fav/(unfav) Referenced PPI Sub-Indices PPI Code 2014 2015 fav/(unfav) 2015 2015 fav/(unfav)
[1] [2] [3] [4] [5] [6] [7] [8] [9] [10] [11] [12] [13] [14] [15] [16]
Butter Alternative, Liquid GFGB $0.69 $0.61 11.9% 14,400,217 $9,941,427 $8,755,521 11.9% Margarine, butter blends, and butter substitutes WPU02780109 318 316 0.8% $0.68 $9,859,942 0.8%
Oil, Soybean $0.62 $0.53 14.3% 2,023,542 $1,249,038 $1,070,602 14.3% Cooking oils WPU02780115 83 78 5.6% $0.58 $1,179,431 5.6%
Shortening, Creamy GFGB $0.61 $0.54 12.2% 9,336,495 $5,692,954 $4,999,218 12.2% Cooking oils WPU02780115 83 78 5.6% $0.58 $5,375,692 5.6%
Overall Performance $16,883,418 $14,825,341 12.2% Overall Performance $16,415,064 2.8%
Sources & Notes:
[1]: Products are based on Pancake Price Index.
[2]: Average actual store cost for 2014 is calculated by taking the average of prices from January 2014 through December 2014.
[3]: Average actual store cost for 2015 is calculated by taking the average of prices from January 2015 through December 2015.
[4]: Change in average actual store cost= -{[3] - [2]}/[2].
[5]: Budgeted volumes for 2015 are based on Pancake Price Index.
[6]: [2] x [5].
[7]: [3] x [5].
[8]: -{[7] - [6]}/[6]. Notice that [4] & [8] have the same results.
[9]: PPI sub-indices are selected based on resemblance with products in Pancake Market Basket.
[10]: See PPI Codes on the Bureau of Labor Statistics: http://www.bls.gov/news.release/pdf/ppi.pdf
[11]: Data were retrieved from the Bureau of Labor Statistic website: http://data.bls.gov/cgi-bin/srgate
[12]: Data were retrieved from the Bureau of Labor Statistic website: http://data.bls.gov/cgi-bin/srgate
[13]: Change in PPI sub-indices = -{[12] - [11]}/[11].
[14]: [2] x {1 - [13]}.
[15]: [5] x [14].
[16]: -{[15] - [6]}/[6]. Notice that [13] & [16] have the same results.