
Page 232 - Aida Hovsepian Onboarding
P. 232
PROCUREMENT
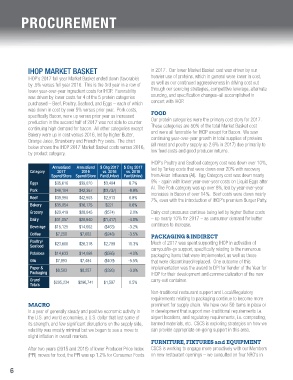
IHOP MARKET BASKET in 2017. Our lower Market Basket cost was driven by our
IHOP’s 2017 full year Market Basket ended down (favorable) heavier use of proteins, which in general were lower in cost,
by .5% versus full year 2016. This is the 3rd year in a row of as well as our continued aggressiveness in driving cost out
lower year-over-year ingredient costs for IHOP. Favorability through our sourcing strategies, competitive leverage, alternate
was driven by lower costs for 4 of the 5 protein categories sourcing, and specification changes–all accomplished in
purchased – Beef, Poultry, Seafood, and Eggs – each of which concert with IHOP.
was down in cost by over 5% versus prior year. Pork costs,
specifically Bacon, were up versus prior year as increased FOOD
production in the second half of 2017 was not able to counter Our protein categories were the primary cost story for 2017.
continuing high demand for bacon. All other categories except These categories are 50% of the total Market Basket cost
Bakery were up in cost versus 2016, led by higher Butter, and were all favorable for IHOP except for Bacon. We saw
Orange Juice, Strawberry and French Fry costs. The chart continuing year-over-year growth in total supplies of proteins
below shows the IHOP 2017 Market Basket costs versus 2016, (all meat and poultry supply up 2.6% in 2017) due primarily to
by product category. low feed costs and good producer returns.
IHOP’s Poultry and Seafood category cost was down over 10%,
Annualized Annualized $ Chg 2017 $ Chg 2017 led by Turkey costs that were down over 20% with recovery
Category 2017 2016 vs. 2016 vs. 2016
Spend/Store Spend/Store Fav/(Unfav) Fav/(Unfav) from Avian Influenza (AI). Egg Category cost was down nearly
Eggs $35,616 $39,020 $3,404 8.7% 9% - again with lower year-over-year costs on Liquid Eggs after
Pork $46,104 $42,367 ($3,737) -8.8% AI. The Pork category was up over 8%, led by year-over-year
Beef $39,990 $42,903 $2,913 6.8% increases in Bacon of over 14%. Beef costs were down nearly
7%, even with the introduction of IHOP’s premium Burger Patty.
Bakery $35,954 $36,175 $221 0.6%
Grocery $29,419 $28,845 ($574) -2.0% Dairy cost pressures continue being led by higher Butter costs
Dairy $31,057 $29,640 ($1,417) -4.8% – up nearly 10% for 2017 – as consumer demand for butter
Beverage $15,125 $14,662 ($463) -3.2% continues to increase.
Coffee $7,250 $7,002 ($248) -3.5% PACKAGING & INDIRECT
Poultry/ Much of 2017 was spent supporting IHOP in activation of
Seafood $23,608 $26,318 $2,709 10.3% carryout/to-go support, specifically relating to the numerous
Potatoes $14,633 $14,068 ($565) -4.0% packaging items that were implemented, as well as those
Oils $7,893 $7,484 ($409) -5.5% that were discontinued/replaced. One outcome of this
Paper & $8,583 $8,257 ($326) -3.9% implementation was the award to DPI for Vendor of the Year for
Packaging IHOP for their development and commercialization of the new
Grand $295,234 $296,741 $1,507 0.5% carry-out container.
Totals
Non-traditional restaurant support and Local/Regulatory
requirements relating to packaging continue to become more
MACRO prominent for supply chain. We have over 50 items in place or
In a year of generally steady and positive economic activity in in development that support non-traditional requirements i.e.
the U.S. and world economies, a U.S. dollar that lost some of airport locations, and regulatory requirements, i.e. composting,
its strength, and few significant disruptions on the supply side, banned materials, etc. CSCS is exploring strategies on how we
volatility was mostly minimal but we began to see a move to can provide appropriate on-going support in this area.
slight inflation in overall markets.
FURNITURE, FIXTURES and EQUIPMENT
After two years (2015 and 2016) of lower Producer Price Index CSCS is working to engage more proactively with our Members
(PPI) moves for food, the PPI was up 1.2% for Consumer Foods on new restaurant openings – we consulted on four NRO’s in
6