
Page 347 - Aida Hovsepian Onboarding
P. 347
Confidential and Privileged
For the Audit and Finance Committee's Review
Work-paper #3-5:
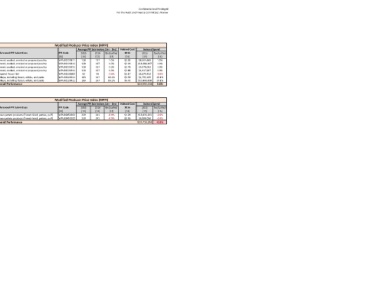
Pancake Market Basket vs. Modified Producer Price Index:
2016 Performance by Category
Category: Poultry/ Seafood
Pancake Market Basket Modified Producer Price Index (MPPI)
Average Actual Store Cost (Jan - Dec) Budgeted Spend Average PPI Sub-Indices (Jan - Dec) Indexed Cost Indexed Spend
Product 2015 2016 fav/(unfav) Volume 2016 2015 2016 fav/(unfav) Referenced PPI Sub-Indices PPI Code 2015 2016 fav/(unfav) 2016 2016 fav/(unfav)
[1] [2] [3] [4] [5] [6] [7] [8] [9] [10] [11] [12] [13] [14] [15] [16]
Chicken, Breast Strips, Stacker Boneless Skinless $2.05 $1.91 6.5% 4,200,000 $8,590,937 $8,029,028 6.5% Canned, cooked, smoked or prepared poultry WPU02220811 128 127 1.0% $2.03 $8,505,669 1.0%
Chicken, Fritter, Tender, Uncooked, 6/5 lbs $2.32 $2.12 8.4% 6,399,996 $14,833,364 $13,589,967 8.4% Canned, cooked, smoked or prepared poultry WPU02220811 128 127 1.0% $2.29 $14,686,137 1.0%
Chicken, RTC, 8 Pieces $2.79 $2.78 0.3% 1,400,004 $3,908,850 $3,898,489 0.3% Canned, cooked, smoked or prepared poultry WPU02220811 128 127 1.0% $2.76 $3,870,053 1.0%
IHOP - Bnls 4 oz Breaded Chicken Breast $2.52 $2.49 1.1% 769,272 $1,937,133 $1,915,944 1.1% Canned, cooked, smoked or prepared poultry WPU02220811 128 127 1.0% $2.49 $1,917,907 1.0%
Tilapia, Fillets, 3-5 oz. $3.09 $2.89 6.5% 750,000 $2,314,499 $2,164,306 6.5% Prepared frozen fish WPU02230602 93 95 -2.6% $3.17 $2,374,452 -2.6%
Turkey, Bacon $2.66 $2.64 0.9% 750,000 $1,994,254 $1,976,631 0.9% Turkeys, including frozen, whole, and parts WPU02220611 163 147 10.1% $2.39 $1,792,169 10.1%
Turkey, Breast, Roasted, Sliced $5.26 $6.08 -15.5% 2,199,996 $11,580,336 $13,374,889 -15.5% Turkeys, including frozen, whole, and parts WPU02220611 163 147 10.1% $4.73 $10,406,858 10.1%
Overall Performance $45,159,375 $44,949,255 0.5% Overall Performance $43,553,244 3.6%
Category: Potatoes
Pancake Market Basket Modified Producer Price Index (MPPI)
Average Actual Store Cost (Jan - Dec) Budgeted Spend Average PPI Sub-Indices (Jan - Dec) Indexed Cost Indexed Spend
Product 2015 2016 fav/(unfav) Volume 2016 2015 2016 fav/(unfav) Referenced PPI Sub-Indices PPI Code 2015 2016 fav/(unfav) 2016 2016 fav/(unfav)
[1] [2] [3] [4] [5] [6] [7] [8] [9] [10] [11] [12] [13] [14] [15] [16]
Hashbrowns, Seasoned $1.28 $1.29 -0.6% 12,248,748 $15,695,228 $15,782,924 -0.6% Frozen potato products (French-fried, patties, puff) WPU02450202 239 241 -0.9% $1.29 $15,835,203 -0.9%
Potatoes, Fries, Uncoated $0.56 $0.58 -3.2% 12,187,344 $6,819,234 $7,036,749 -3.2% Frozen potato products (French-fried, patties, puff) WPU02450202 239 241 -0.9% $0.56 $6,880,050 -0.9%
Overall Performance $22,514,462 $22,819,673 -1.4% Overall Performance $22,715,253 -0.9%
Sources & Notes:
[1]: Products are based on Pancake Price Index.
[2]: Average actual store cost for 2015 is calculated by taking the average of prices from January 2015 through December 2015.
[3]: Average actual store cost for 2016 is calculated by taking the average of prices from January 2016 through December 2016.
[4]: Change in average actual store cost= -{[3] - [2]}/[2].
[5]: Budgeted volumes for 2016 are based on Pancake Price Index. UOM is pound.
[6]: [2] x [5].
[7]: [3] x [5].
[8]: -{[7] - [6]}/[6]. Notice that [4] & [8] have the same results.
[9]: PPI sub-indices are selected based on resemblance with products in Pancake Market Basket.
[10]: See PPI Codes on the Bureau of Labor Statistics: http://www.bls.gov/news.release/pdf/ppi.pdf
[11]: Data were retrieved from the Bureau of Labor Statistic website: http://data.bls.gov/cgi-bin/srgate
[12]: Data were retrieved from the Bureau of Labor Statistic website: http://data.bls.gov/cgi-bin/srgate
[13]: Change in PPI sub-indices = -{[12] - [11]}/[11].
[14]: [2] x {1 - [13]}.
[15]: [5] x [14].
[16]: -{[15] - [6]}/[6]. Notice that [13] & [16] have the same results.