
Page 344 - Aida Hovsepian Onboarding
P. 344
Confidential and Privileged
For the Audit and Finance Committee's Review
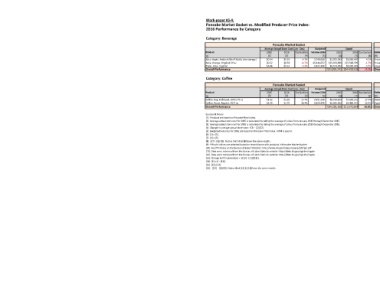
Work-paper #3-4:
Pancake Market Basket vs. Modified Producer Price Index:
2016 Performance by Category
Category: Beverage
Pancake Market Basket Modified Producer Price Index (MPPI)
Average Actual Store Cost (Jan - Dec) Budgeted Spend Average PPI Sub-Indices (Jan - Dec) Indexed Cost Indexed Spend
Product 2015 2016 fav/(unfav) Volume 2016 2015 2016 fav/(unfav) Referenced PPI Sub-Indices PPI Code 2015 2016 fav/(unfav) 2016 2016 fav/(unfav)
[1] [2] [3] [4] [5] [6] [7] [8] [9] [10] [11] [12] [13] [14] [15] [16]
Juice, Apple, Ambient/Shelf Stable (dry storage) $0.54 $0.52 4.7% 3,748,008 $2,025,382 $1,930,470 4.7% Frozen concentrated orange juice, consumer and inst WPU02420301 178 185 -4.0% $0.56 $2,105,812 -4.0%
Juice, Orange, Original, 59 oz $0.52 $0.53 -1.7% 29,414,652 $15,333,898 $15,588,599 -1.7% Frozen concentrated orange juice, consumer and inst WPU02420301 178 185 -4.0% $0.54 $15,942,826 -4.0%
Pepsi- Cola - 5 gallon $4.88 $5.14 -5.3% 1,347,120 $6,573,962 $6,920,249 -5.3% Liquid beverage bases, excluding use by soft drink WPU02640109 181 181 0.1% $4.87 $6,565,208 0.1%
Overall Performance $23,933,242 $24,439,318 -2.1% Overall Performance $24,613,845 -2.8%
Category: Coffee
Pancake Market Basket Modified Producer Price Index (MPPI)
Average Actual Store Cost (Jan - Dec) Budgeted Spend Average PPI Sub-Indices (Jan - Dec) Indexed Cost Indexed Spend
Product 2015 2016 fav/(unfav) Volume 2016 2015 2016 fav/(unfav) Referenced PPI Sub-Indices PPI Code 2015 2016 fav/(unfav) 2016 2016 fav/(unfav)
[1] [2] [3] [4] [5] [6] [7] [8] [9] [10] [11] [12] [13] [14] [15] [16]
Coffee, Reg, Intl Roast, 100/2.75 oz $3.42 $2.82 17.7% 2,551,248 $8,730,104 $7,185,131 17.7% Roasted coffee WPU02630104 181 172 4.8% $3.26 $8,313,753 4.8%
Coffee, Roast, Regular, 40/7 oz $3.39 $2.76 18.4% 1,624,440 $5,505,056 $4,490,473 18.4% Roasted coffee WPU02630104 181 172 4.8% $3.23 $5,242,512 4.8%
Overall Performance $14,235,160 $11,675,604 18.0% Overall Performance $13,556,264 4.8%
Sources & Notes:
[1]: Products are based on Pancake Price Index.
[2]: Average actual store cost for 2015 is calculated by taking the average of prices from January 2015 through December 2015.
[3]: Average actual store cost for 2016 is calculated by taking the average of prices from January 2016 through December 2016.
[4]: Change in average actual store cost= -{[3] - [2]}/[2].
[5]: Budgeted volumes for 2016 are based on Pancake Price Index. UOM is pound.
[6]: [2] x [5].
[7]: [3] x [5].
[8]: -{[7] - [6]}/[6]. Notice that [4] & [8] have the same results.
[9]: PPI sub-indices are selected based on resemblance with products in Pancake Market Basket.
[10]: See PPI Codes on the Bureau of Labor Statistics: http://www.bls.gov/news.release/pdf/ppi.pdf
[11]: Data were retrieved from the Bureau of Labor Statistic website: http://data.bls.gov/cgi-bin/srgate
[12]: Data were retrieved from the Bureau of Labor Statistic website: http://data.bls.gov/cgi-bin/srgate
[13]: Change in PPI sub-indices = -{[12] - [11]}/[11].
[14]: [2] x {1 - [13]}.
[15]: [5] x [14].
[16]: -{[15] - [6]}/[6]. Notice that [13] & [16] have the same results.