
Page 343 - Aida Hovsepian Onboarding
P. 343
Confidential and Privileged
For the Audit and Finance Committee's Review
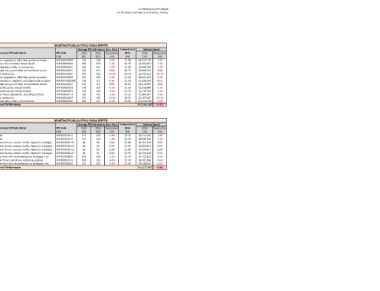
Work-paper #3-3:
Pancake Market Basket vs. Modified Producer Price Index:
2016 Performance by Category
Category: Grocery
Pancake Market Basket Modified Producer Price Index (MPPI)
Average Actual Store Cost (Jan - Dec) Budgeted Spend Average PPI Sub-Indices (Jan - Dec) Indexed Cost Indexed Spend
Product 2015 2016 fav/(unfav) Volume 2016 2015 2016 fav/(unfav) Referenced PPI Sub-Indices PPI Code 2015 2016 fav/(unfav) 2016 2016 fav/(unfav)
[1] [2] [3] [4] [5] [6] [7] [8] [9] [10] [11] [12] [13] [14] [15] [16]
Blend, Fajita, Fire Roasted Poblano, IQF $1.97 $1.89 4.0% 1,322,580 $2,601,168 $2,497,348 4.0% Frozen vegetables, other than potato products WPU02450509 136 136 -0.4% $1.98 $2,612,179 -0.4%
Cheesecake, Cubes, Petite New York $2.75 $2.57 6.6% 708,096 $1,948,397 $1,819,909 6.6% Frozen Pies and Other Baked Goods WPU02850109 266 270 -1.3% $2.79 $1,972,961 -1.3%
Compote, Blueberry, Globe $1.32 $1.31 0.4% 1,934,652 $2,549,908 $2,540,185 0.4% Canned jams, jellies, and preserves WPU02810102 164 167 -2.0% $1.34 $2,600,199 -2.0%
Ketchup 20 oz., Upside Down $0.74 $0.74 0.2% 5,556,312 $4,139,133 $4,130,144 0.2% Canned catsup and other tomato based sauces WPU02440127 156 151 3.6% $0.72 $3,988,743 3.6%
Old Fashioned Maple Syrup $4.23 $4.71 -11.3% 1,198,788 $5,074,921 $5,647,835 -11.3% Corn sweeteners WPU02540107 167 189 -13.1% $4.79 $5,742,213 -13.1%
Onion Rings, Crumb Breaded, Gourmet, 3/4" $1.09 $1.13 -3.5% 2,747,928 $3,008,530 $3,113,140 -3.5% Frozen vegetables, other than potato products WPU02450509 136 136 -0.4% $1.10 $3,021,264 -0.4%
Pasta, Macaroni & Cheese $1.61 $1.61 -0.1% 842,004 $1,351,776 $1,352,830 -0.1% Dry macaroni, spaghetti, and egg noodle products WPU0214020303 120 115 4.1% $1.54 $1,296,063 4.1%
Salsa with Hot Sauce $0.83 $1.07 -29.4% 2,524,572 $2,093,045 $2,708,708 -29.4% Canned catsup and other tomato based sauces WPU02440127 156 151 3.6% $0.80 $2,016,997 3.6%
Sauce, Hollandaise $1.36 $1.35 0.2% 1,339,476 $1,815,633 $1,812,228 0.2% Prepared sauces, except tomato WPU02860103 158 158 -0.1% $1.36 $1,816,684 -0.1%
Sauce, White Cream Base $1.44 $1.48 -2.9% 1,212,732 $1,748,723 $1,798,930 -2.9% Prepared sauces, except tomato WPU02860103 158 158 -0.1% $1.44 $1,749,735 -0.1%
Soup, Potato and Bacon Concentrate $1.22 $1.19 3.2% 1,526,880 $1,870,366 $1,810,947 3.2% Other Frozen Specialties, Excluding Seafood WPU02850113 184 185 -0.6% $1.23 $1,882,381 -0.6%
Syrup Cups, To Go $0.82 $0.91 -9.9% 2,419,380 $1,994,777 $2,192,363 -9.9% Corn sweeteners WPU02540107 167 189 -13.1% $0.93 $2,257,067 -13.1%
Whole Strawberries in Topping $1.53 $1.66 -8.2% 8,099,184 $12,404,940 $13,424,453 -8.2% Canned jams, jellies, and preserves WPU02810102 164 167 -2.0% $1.56 $12,649,596 -2.0%
Overall Performance $42,601,316 $44,849,020 -5.3% Overall Performance $43,606,082 -2.4%
Category: Dairy
Pancake Market Basket Modified Producer Price Index (MPPI)
Average Actual Store Cost (Jan - Dec) Budgeted Spend Average PPI Sub-Indices (Jan - Dec) Indexed Cost Indexed Spend
Product 2015 2016 fav/(unfav) Volume 2016 2015 2016 fav/(unfav) Referenced PPI Sub-Indices PPI Code 2015 2016 fav/(unfav) 2016 2016 fav/(unfav)
[1] [2] [3] [4] [5] [6] [7] [8] [9] [10] [11] [12] [13] [14] [15] [16]
Butter, Unsalted, Solids, 36/1 lb $2.19 $2.35 -7.6% 1,577,736 $3,448,082 $3,710,562 -7.6% Butter WPU02320114 147 150 -1.8% $2.23 $3,511,265 -1.8%
Butter, Whipped Salted $2.36 $2.52 -7.0% 3,683,950 $8,679,158 $9,285,725 -7.0% Butter WPU02320114 147 150 -1.8% $2.40 $8,838,196 -1.8%
Cheese, 50/50 Mont Jack/Ched Col, Fancy Shred $2.11 $1.92 9.1% 1,850,748 $3,905,151 $3,550,949 9.1% Natural cheese, except lowfat, shipped in packages WPU023302122 86 83 3.5% $2.04 $3,767,220 3.5%
Cheese, American, 160 Slice Col $1.99 $1.83 8.2% 1,042,836 $2,074,129 $1,903,494 8.2% Natural cheese, except lowfat, shipped in packages WPU023302122 86 83 3.5% $1.92 $2,000,870 3.5%
Cheese, Fancy Shred Cheddar, 4/5 lb $2.12 $1.94 8.3% 3,907,620 $8,270,477 $7,584,855 8.3% Natural cheese, except lowfat, shipped in packages WPU023302122 86 83 3.5% $2.04 $7,978,361 3.5%
Cheese, Sharp White Cheddar, Sliced $2.62 $2.51 4.3% 1,003,548 $2,627,035 $2,515,266 4.3% Natural cheese, except lowfat, shipped in packages WPU023302122 86 83 3.5% $2.53 $2,534,248 3.5%
Creamer, Portion, Aseptic, Half & Half $1.31 $1.30 0.1% 5,553,480 $7,252,573 $7,245,662 0.1% Other fluid milk related products, packaged, incl. WPU02310304 222 236 -6.5% $1.39 $7,722,302 -6.5%
Mozzarella Cheese Stick, Breaded $1.77 $1.71 3.3% 2,458,236 $4,353,966 $4,211,099 3.3% Other frozen specialties, excluding seafood WPU02850113 184 185 -0.6% $1.78 $4,381,936 -0.6%
Whipped Cream, Non Dairy Aerosol $1.39 $1.44 -3.5% 2,461,356 $3,417,183 $3,535,980 -3.5% Other fluid milk related products, packaged, incl. WPU02310304 222 236 -6.5% $1.48 $3,638,504 -6.5%
Overall Performance $44,027,754 $43,543,593 1.1% Overall Performance $44,372,901 -0.8%
Sources & Notes:
[1]: Products are based on Pancake Price Index.
[2]: Average actual store cost for 2015 is calculated by taking the average of prices from January 2015 through December 2015.
[3]: Average actual store cost for 2016 is calculated by taking the average of prices from January 2016 through December 2016.
[4]: Change in average actual store cost= -{[3] - [2]}/[2].
[5]: Budgeted volumes for 2016 are based on Pancake Price Index. UOM is pound.
[6]: [2] x [5].
[7]: [3] x [5].
[8]: -{[7] - [6]}/[6]. Notice that [4] & [8] have the same results.
[9]: PPI sub-indices are selected based on resemblance with products in Pancake Market Basket.
[10]: See PPI Codes on the Bureau of Labor Statistics: http://www.bls.gov/news.release/pdf/ppi.pdf
[11]: Data were retrieved from the Bureau of Labor Statistic website: http://data.bls.gov/cgi-bin/srgate
[12]: Data were retrieved from the Bureau of Labor Statistic website: http://data.bls.gov/cgi-bin/srgate
[13]: Change in PPI sub-indices = -{[12] - [11]}/[11].
[14]: [2] x {1 - [13]}.
[15]: [5] x [14].
[16]: -{[15] - [6]}/[6]. Notice that [13] & [16] have the same results.