
Page 341 - Aida Hovsepian Onboarding
P. 341
Confidential and Privileged
For the Audit and Finance Committee's Review
Work-paper #3-2:
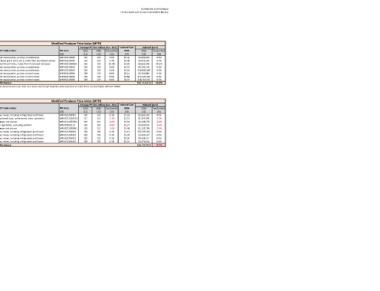
Pancake Market Basket vs. Modified Producer Price Index:
2016 Performance by Category
Category: Beef
Pancake Market Basket Modified Producer Price Index (MPPI)
Average Actual Store Cost (Jan - Dec) Budgeted Spend Average PPI Sub-Indices (Jan - Dec) Indexed Cost Indexed Spend
Product 2015 2016 fav/(unfav) Volume 2016 2015 2016 fav/(unfav) Referenced PPI Sub-Indices PPI Code 2015 2016 fav/(unfav) 2016 2016 fav/(unfav)
[1] [2] [3] [4] [5] [6] [7] [8] [9] [10] [11] [12] [13] [14] [15] [16]
Beef, 4oz sirloin ball tips $6.02 $6.06 -0.8% 752,484 $4,526,543 $4,563,158 -0.8% Frozen ground meat patties, portion control meats WPU02210586 138 125 9.6% $5.44 $4,090,056 9.6%
Beef, Fully Cooked Pot Roast $3.62 $3.69 -1.9% 1,276,372 $4,625,890 $4,712,432 -1.9% Boxed meat (beef, pork, lamb, etc.), made from purchased carcass WPU02210504 119 114 3.7% $3.49 $4,453,335 3.7%
Beef, Ground, Patty, 6 oz $2.57 $2.29 11.0% 3,337,720 $8,568,183 $7,627,600 11.0% Frozen Ground Meat Patties, made from Purchased Carcasses WPU022105863Ɨ 156 125 20.3% $2.05 $6,830,359 20.3%
Beef, Philly Meat $4.68 $4.17 11.0% 1,500,000 $7,022,283 $6,250,782 11.0% Frozen ground meat patties, portion control meats WPU02210586 138 125 9.6% $4.23 $6,345,136 9.6%
Beef, Steak Fritters, 8 oz, 35/cs $3.35 $3.37 -0.8% 3,600,000 $12,044,965 $12,136,668 -0.8% Frozen ground meat patties, portion control meats WPU02210586 138 125 9.6% $3.02 $10,883,489 9.6%
Steak, Omelet Strips, 4 oz $3.55 $3.56 -0.2% 1,971,000 $7,006,510 $7,018,110 -0.2% Frozen ground meat patties, portion control meats WPU02210586 138 125 9.6% $3.21 $6,330,884 9.6%
Steak, T-Bone, 12 oz $6.29 $6.31 -0.4% 2,115,312 $13,303,140 $13,356,488 -0.4% Frozen ground meat patties, portion control meats WPU02210586 138 125 9.6% $5.68 $12,020,340 9.6%
Steak, Tips, 8 oz, Beef Seasoned Sirloin Cubes $4.51 $4.40 2.3% 3,624,360 $16,338,510 $15,964,300 2.3% Frozen ground meat patties, portion control meats WPU02210586 138 125 9.6% $4.07 $14,763,015 9.6%
Overall Performance $73,436,024 $71,629,538 2.5% Overall Performance $65,716,613 10.5%
Ɨ The index was discontinued in July 2016. As a result, July through December data came from an index that is one level higher (WPU02210586).
Category: Bakery
Pancake Market Basket Modified Producer Price Index (MPPI)
Average Actual Store Cost (Jan - Dec) Budgeted Spend Average PPI Sub-Indices (Jan - Dec) Indexed Cost Indexed Spend
Product 2015 2016 fav/(unfav) Volume 2016 2015 2016 fav/(unfav) Referenced PPI Sub-Indices PPI Code 2015 2016 fav/(unfav) 2016 2016 fav/(unfav)
[1] [2] [3] [4] [5] [6] [7] [8] [9] [10] [11] [12] [13] [14] [15] [16]
Batter Concentrate, French Toast $1.52 $1.31 13.6% 2,349,072 $3,565,468 $3,080,482 13.6% Prepared flour mixes, including refrigerated and frozen WPU021204011 102 102 0.1% $1.52 $3,563,432 0.1%
Bread, Brioche $1.48 $1.48 -0.2% 1,290,588 $1,911,813 $1,914,780 -0.2% Other variety breads (rye, unleavened, raisin, potatoes) WPU0211020114 111 113 -2.2% $1.51 $1,953,905 -2.2%
Brioche Bun 4.25 $1.31 $1.40 -6.7% 1,606,788 $2,106,480 $2,246,651 -6.7% Rolls, hamburger and wiener WPU0211050501 110 112 -2.0% $1.34 $2,148,578 -2.0%
French Toast, Stuffed, Original, ZTF $2.25 $2.25 0.0% 1,324,752 $2,981,775 $2,982,763 0.0% Other frozen specialties, excluding seafood WPU02850113 184 185 -0.6% $2.27 $3,000,929 -0.6%
Hoagie Roll, Soft $1.45 $1.45 0.0% 898,116 $1,306,684 $1,306,042 0.0% Rolls, hamburger and wiener WPU0211050501 110 112 -2.0% $1.48 $1,332,798 -2.0%
Pancake Mix, Buttermilk $1.13 $1.11 1.5% 31,399,896 $35,526,224 $35,007,032 1.5% Prepared flour mixes, including refrigerated and frozen WPU021204011 102 102 0.1% $1.13 $35,505,941 0.1%
Pancake Mix, Egg Batter $1.09 $1.12 -3.2% 2,667,900 $2,902,254 $2,993,970 -3.2% Prepared flour mixes, including refrigerated and frozen WPU021204011 102 102 0.1% $1.09 $2,900,597 0.1%
Pancake Mix, Harvest Grain N' Nut $3.30 $3.34 -1.2% 1,374,816 $4,540,709 $4,593,114 -1.2% Prepared flour mixes, including refrigerated and frozen WPU021204011 102 102 0.1% $3.30 $4,538,117 0.1%
Waffle Mix, Golden Belgian $1.31 $1.35 -3.1% 2,658,972 $3,478,642 $3,586,732 -3.1% Prepared flour mixes, including refrigerated and frozen WPU021204011 102 102 0.1% $1.31 $3,476,656 0.1%
Overall Performance $58,320,048 $57,711,566 1.0% Overall Performance $58,420,953 -0.2%
Sources & Notes:
[1]: Products are based on Pancake Price Index.
[2]: Average actual store cost for 2015 is calculated by taking the average of prices from January 2015 through December 2015.
[3]: Average actual store cost for 2016 is calculated by taking the average of prices from January 2016 through December 2016.
[4]: Change in average actual store cost= -{[3] - [2]}/[2].
[5]: Budgeted volumes for 2016 are based on Pancake Price Index. UOM is pound.
[6]: [2] x [5].
[7]: [3] x [5].
[8]: -{[7] - [6]}/[6]. Notice that [4] & [8] have the same results.
[9]: PPI sub-indices are selected based on resemblance with products in Pancake Market Basket.
[10]: See PPI Codes on the Bureau of Labor Statistics: http://www.bls.gov/news.release/pdf/ppi.pdf
[11]: Data were retrieved from the Bureau of Labor Statistic website: http://data.bls.gov/cgi-bin/srgate
[12]: Data were retrieved from the Bureau of Labor Statistic website: http://data.bls.gov/cgi-bin/srgate
[13]: Change in PPI sub-indices = -{[12] - [11]}/[11].
[14]: [2] x {1 - [13]}.
[15]: [5] x [14].
[16]: -{[15] - [6]}/[6]. Notice that [13] & [16] have the same results.