
Page 339 - Aida Hovsepian Onboarding
P. 339
Confidential and Privileged
For the Audit and Finance Committee's Review
Work-paper #3-1:
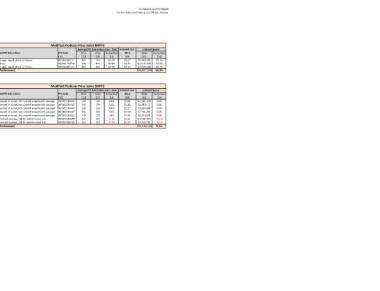
Pancake Market Basket vs. Modified Producer Price Index:
2016 Performance by Category
Category: Eggs
Pancake Market Basket Modified Producer Price Index (MPPI)
Average Actual Store Cost (Jan - Dec) Budgeted Spend Average PPI Sub-Indices (Jan - Dec) Indexed Cost Indexed Spend
Product 2015 2016 fav/(unfav) Volume 2016 2015 2016 fav/(unfav) Referenced PPI Sub-Indices PPI Code 2015 2016 fav/(unfav) 2016 2016 fav/(unfav)
[1] [2] [3] [4] [5] [6] [7] [8] [9] [10] [11] [12] [13] [14] [15] [16]
Egg Whites $1.58 $1.64 -3.6% 2,598,396 $4,102,594 $4,249,980 -3.6% Processed eggs, liquid, dried, or frozen WPU02830111 287 104 63.7% $0.57 $1,490,456 63.7%
Egg, Fresh Shell, Medium Loose $1.62 $0.71 56.5% 18,362,508 $29,783,245 $12,948,112 56.5% Eggs, medium WPU01710704 231 103 55.5% $0.72 $13,247,376 55.5%
Egg, Liquid, w/Citric $0.91 $0.94 -2.4% 45,000,000 $41,149,550 $42,137,593 -2.4% Processed eggs, liquid, dried, or frozen WPU02830111 287 104 63.7% $0.33 $14,949,466 63.7%
Overall Performance $75,035,388 $59,335,685 20.9% Overall Performance $29,687,298 60.4%
Category: Pork
Pancake Market Basket Modified Producer Price Index (MPPI)
Average Actual Store Cost (Jan - Dec) Budgeted Spend Average PPI Sub-Indices (Jan - Dec) Indexed Cost Indexed Spend
Product 2015 2016 fav/(unfav) Volume 2016 2015 2016 fav/(unfav) Referenced PPI Sub-Indices PPI Code 2015 2016 fav/(unfav) 2016 2016 fav/(unfav)
[1] [2] [3] [4] [5] [6] [7] [8] [9] [10] [11] [12] [13] [14] [15] [16]
Bacon, Layout, 16/20, 25 lb $2.07 $2.36 -14.2% 15,999,996 $33,046,569 $37,748,358 -14.2% Pork, processed or cured, not canned or made into sausage WPU02210447 139 139 0.4% $2.06 $32,902,200 0.4%
Bacon, Slab, 16/20 $1.99 $2.25 -13.1% 1,000,000 $1,989,865 $2,251,261 -13.1% Pork, processed or cured, not canned or made into sausage WPU02210447 139 139 0.4% $1.98 $1,981,172 0.4%
Ham, Diced, WA, GFGB, 4/5 lbs $2.18 $2.08 4.7% 1,640,112 $3,575,705 $3,406,707 4.7% Pork, processed or cured, not canned or made into sausage WPU02210447 139 139 0.4% $2.17 $3,560,084 0.4%
Ham, Sliced, 4 oz $2.65 $2.51 5.4% 2,862,312 $7,579,370 $7,173,707 5.4% Pork, processed or cured, not canned or made into sausage WPU02210447 139 139 0.4% $2.64 $7,546,259 0.4%
Ham, Water Added $1.99 $1.89 5.2% 1,323,912 $2,635,416 $2,499,143 5.2% Pork, processed or cured, not canned or made into sausage WPU02210447 139 139 0.4% $1.98 $2,623,903 0.4%
Sausage, Link, GFGB FC Skin-On, 20 lbs $1.69 $1.65 1.9% 8,161,404 $13,757,405 $13,491,093 1.9% Fresh/processed sausage, deli & cooked meats, etc. WPU02210503 152 152 -0.1% $1.69 $13,767,975 -0.1%
Sausage, Split Smoked $1.97 $1.91 3.0% 1,596,060 $3,148,306 $3,054,568 3.0% Fresh/processed sausage, deli & cooked meats, etc. WPU02210503 152 152 -0.1% $1.97 $3,150,725 -0.1%
Overall Performance $65,732,636 $69,624,836 -5.9% Overall Performance $65,532,318 0.3%
Sources & Notes:
[1]: Products are based on Pancake Price Index.
[2]: Average actual store cost for 2015 is calculated by taking the average of prices from January 2015 through December 2015.
[3]: Average actual store cost for 2016 is calculated by taking the average of prices from January 2016 through December 2016.
[4]: Change in average actual store cost= -{[3] - [2]}/[2].
[5]: Budgeted volumes for 2016 are based on Pancake Price Index. UOM is pound.
[6]: [2] x [5].
[7]: [3] x [5].
[8]: -{[7] - [6]}/[6]. Notice that [4] & [8] have the same results.
[9]: PPI sub-indices are selected based on resemblance with products in Pancake Market Basket.
[10]: See PPI Codes on the Bureau of Labor Statistics: http://www.bls.gov/news.release/pdf/ppi.pdf
[11]: Data were retrieved from the Bureau of Labor Statistic website: http://data.bls.gov/cgi-bin/srgate
[12]: Data were retrieved from the Bureau of Labor Statistic website: http://data.bls.gov/cgi-bin/srgate
[13]: Change in PPI sub-indices = -{[12] - [11]}/[11].
[14]: [2] x {1 - [13]}.
[15]: [5] x [14].
[16]: -{[15] - [6]}/[6]. Notice that [13] & [16] have the same results.