
Page 45 - UL_Report On_Part 1
P. 45
35 IITGN-UL/Façade 36 IITGN-UL/Façade
First Floor Roof Level t-T Curves
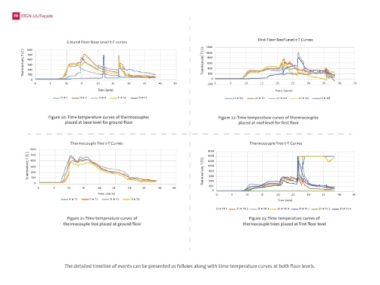
Ground Floor Base Level t-T curves
1200
600
Temperature, T ( C) 400 Temperature, T ( C) 800
1000
500
600
300
400
(c) Fire Behavior 200 0 200 0
100
0 5 10 15 20 25 30 35 40 45 -200
(Growth, Flashover and Decay) Time (min) Time, t(min)
11 # 1 11 # 2 11 # 9 11 # 16 11 # 17 21 # 56 21 # 57 21 # 64 21 # 65 21 # 68
The test compartment was subjected to external fire by
igniting the wood crib placed outside the compartment
near the glass façade assembly. The flames from the crib Figure 20: Time temperature curves of thermocouples Figure 22: Time temperature curves of thermocouples
penetrated through the ventilation and allowed cotton placed at base level for ground floor placed at roof level for first floor
curtains to catch fire. Curtains allowed the fire to spread
to the wooden crib placed within the compartment and
subsequently to other items placed within the test room. Ground Floor Roof Level t-T curves Thermocouple Tree t-T Curves Thermocouple Tree t-T Curves
1000 600
The convective plume of the hot gases above the burning 800 500 1600
1400
object (wood crib within the compartment) hit the 600 400 1200
ceiling and spread horizontally to form a hot upper layer. Temperature, T ( C) Temperature, T ( C) 300 1000
In the early stage of fire, the rate of burning was 400 200 Temperature, T ( C) 800
600
significantly enhanced by radiant feedback from this hot 200 100 400
upper layer. 0 0 0 5 10 15 20 25 30 35 40 45 200
Figure 19, Figure 20 & Figure 21 show the time 0 5 10 15 20 25 30 35 40 45 Time, t (min) 0 0 5 10 15 20 25 30 35 40 45
temperature data recorded by thermocouples placed at Time, t(min) 11 # T1 11 # T2 11 # T3 11 # T4 Time (min)
base & roof levels for ground floor along with 11 # 22 11 # 23 11 # 30 11 # 31 11 # 34
thermocouple tree. Time temperature curves for first 21 # TR 1 21 # TR 2 21 # TR 3 21 # TR 4 21 # TL 1 21 # TL 2 21 # TL 4
floor roof level thermocouples and of thermocouple trees Figure 21: Time temperature curves of Figure 23: Time temperature curves of
are presented in Figure 22 & Figure 23. Figure 19: Time temperature curves of thermocouples placed at roof level for ground floor thermocouple tree placed at ground floor thermocouple trees placed at first floor level
The detailed timeline of events can be presented as follows along with time temperature curves at both floor levels.