
Page 13 - ASBIRES-2017_Preceedings
P. 13
Madushani, Wickramasinghe & Aponsu
2
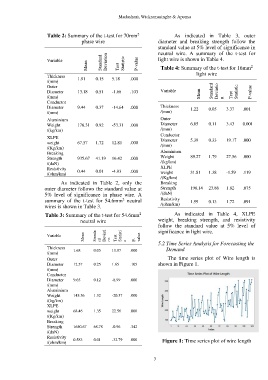
Table 2: Summary of the t-test for 70mm As indicated in Table 3, outer
phase wire diameter and breaking strength follow the
standard value at 5% level of significance in
neutral wire. A summary of the t-test for
Variable Standard Deviation light wire is shown in Table 4.
Mean Test Statistic P-value Table 4: Summary of the t-test for 16mm
2
Thickness 1.91 0.15 5.18 .000 light wire
/(mm)
Outer
Diameter 13.18 0.51 -1.66 .103 Variable Mean Standard Deviatio Statistic P-value
/(mm) n Test
Conductor
Diameter 9.44 0.37 -14.64 .000 Thickness 1.22 0.05 3.37 .001
/(mm) /(mm)
Aluminium Outer
Weight 176.31 0.92 -53.31 .000 Diameter 6.85 0.11 3.43 0.001
/(kg/km) /(mm)
Conductor
XLPE
weight 67.57 1.72 12.81 .000 Diameter 5.39 0.33 19.17 .000
/(mm)
/(Kg/km)
Breaking Aluminium
Strength 935.67 41.19 16.42 .000 Weight 89.27 1.79 27.56 .000
/(daN) /(kg/km)
Resistivity XLPE
/(ohm/km) 0.44 0.01 -4.93 .000 weight 31.81 1.38 -1.59 .119
/(Kg/km)
As indicated in Table 2, only the Breaking
outer diameter follows the standard value at Strength 196.14 23.86 1.82 .075
5% level of significance in phase wire. A /(daN)
2
summary of the t-test for 54.6mm neutral Resistivity 1.99 0.13 1.72 .091
wires is shown in Table 3. /(ohm/km)
2
Table 3: Summary of the t-test for 54.6mm As indicated in Table 4, XLPE
neutral wire weight, breaking strength, and resistivity
follow the standard value at 5% level of
Mean rd on Test P- value
Variable Standa Deviati Statisti significance in light wire.
c
5.2 Time Series Analysis for Forecasting the
Thickness 1.68 0.05 11.87 .000 Demand
/(mm)
Outer The time series plot of Wire length is
Diameter 12.57 0.25 1.65 .105 shown in Figure 1.
/(mm)
Conductor
Diameter 9.65 0.12 -8.99 .000
/(mm)
Aluminium
Weight 145.56 1.32 -20.37 .000
/(kg/km)
XLPE
weight 68.46 1.35 22.56 .000
/(Kg/km)
Breaking
Strength 1650.67 68.78 -0.96 .342
/(daN)
Resistivity
/(ohm/km) 0.583 0.01 -32.79 .000 Figure 1: Time series plot of wire length
3