
Page 38 - Complete IELTS Bands 5 - 6.5
P. 38
0 Complete the gaps in this summary with the 0 @ Find and correct the mistakes made by IELTS
correct percentages. students in these sentences.
I The oldest underground railway v<:"as built in
The table provides some bac.kground information on the
London en 1863. i-1-1.
staff working in a global hotel c.hain. The information 2 In general, all the figures gradually increased
goes bac.k to 1975 and c.overs languages spoken and over 1911 to 2001.
quallfic.atlons, as well as previous work experienc.e. 3 There is no evidence that a rise of petrol prices
leads to less traffic.
Between 1975 and 2000, there was a signilkant rise in
4 The number of people peaked to 5,523 in 2001.
the perc.entage of employees who held a quallfic.atlon in
5 Spending on teachers' salaries fell on 5%.
a foreign language, from 1 .............. to 2 .................. After
6 The temperature decreased until a low of three
this, there was a slight fall of a .................. over the next ten
degrees in December.
years.
7 During the period of 1986 and 1999 there was a
'I .. .. . . . . . . . of staff were able to speak at least two gradual increase.
languages in 1975. At first, this figure rose by 13 perc.entto 8 The profits experienced an increase by $2m.
5 ... . . . in 1990. 1-\-owever, from 1990 to 2010. it roc.keted
(ID Work in pairs. Look at the Writing task below
to6 .......... .
and decide:
finally, the perc.entage of staff with experienc.e in the
• what the graph shows
hotel industry fluc.tuated between 1975 and 2010. In 1955,
• how you will organise your report - what each
there was a peak at7 ................. ,and this was followed by paragraph will contain
a sudden fall to 6 ................ five years later. figures then • what your overview will include.
went up and down over the next 15 years. Work alone and write your summary. You should
write at least ISO words.
0 Underline the expressions that describe trends in
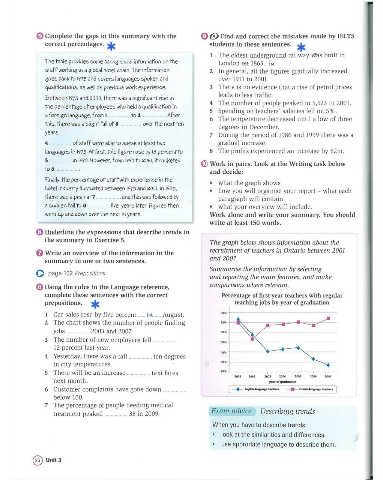
the summary in Exercise 5. The graph below shows information about the
recruitment of teachers in Ontario between 2001
0 Write an overview of the information in the
and 2007.
summary in one or two sentences.
Summarise the information by selecting
0 page 102 Prepositions
and reporting the main features, and make
~ Using the rules in the Language reference, comparisons where relevant.
complete these sentences with the correct Percentage of first-year teachers with regular
prepositions. teaching jobs by year of graduation
I Car sales rose by five percent ....... !:1-1 ....... August. 80%
2 The chart shows the number of people finding 70%
jobs ......... 2003 and 2007. 60%
3 The number of new employees fell ................. .
50%
12 percent last year.
40%
4 Yesterday, there was a fall . .............. ten degrees
in city temperatures. 30% - ---- ----
5 There will be an increase ...... taxi fares 20% L._.,----------...,-------
2001 2002 2003 2004 2005 2006 2007
next month. year of graduation
6 Customer complaints have gone down [+--~~----=-=-~-... J
below 100.
7 The percentage of people needing medical
Exam advice Describing trends
treatment peaked ..... . ... . ... 35 in 2009.
When you have to describe trends:
look at the similarities and differences.
• use approriate language to describe them.
@ Unit3