
Page 65 - SE Outlook Regions 2023
P. 65
The key manufacturing industry fell by 0.4% y/y in the first ten months,
while the mining and quarrying edged up 0.5%. The output in the utility
sector was 6.1% higher.
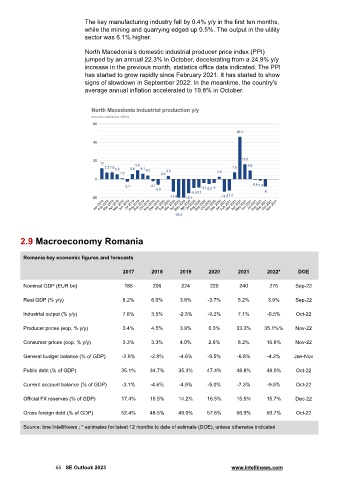
North Macedonia’s domestic industrial producer price index (PPI)
jumped by an annual 22.3% in October, decelerating from a 24.9% y/y
increase in the previous month, statistics office data indicated. The PPI
has started to grow rapidly since February 2021. It has started to show
signs of slowdown in September 2022. In the meantime, the country's
average annual inflation accelerated to 19.8% in October.
2.9 Macroeconomy Romania
Romania key economic figures and forecasts
2017 2018 2019 2020 2021 2022* DOE
Nominal GDP (EUR bn) 186 206 224 220 240 275 Sep-22
Real GDP (% y/y) 8.2% 6.0% 3.8% -3.7% 5.2% 3.9% Sep-22
Industrial output (% y/y) 7.8% 3.5% -2.3% -9.2% 7.1% -0.5% Oct-22
Producer prices (eop, % y/y) 3.4% 4.5% 3.9% 0.3% 33.3% 35.1%% Nov-22
Consumer prices (eop, % y/y) 3.3% 3.3% 4.0% 2.6% 8.2% 16.8% Nov-22
General budget balance (% of GDP) -2.8% -2.8% -4.6% -9.5% -6.8% -4.2% Jan-Nov
Public debt (% of GDP) 35.1% 34.7% 35.3% 47.4% 48.8% 48.0% Oct-22
Current account balance (% of GDP) -3.1% -4.6% -4.9% -5.0% -7.3% -9.5% Oct-22
Official FX reserves (% of GDP) 17.4% 15.5% 14.2% 16.5% 15.5% 15.7% Dec-22
Gross foreign debt (% of GDP) 52.4% 48.5% 49.0% 57.6% 56.9% 50.7% Oct-22
Source: bne IntelliNews ; * estimates for latest 12 months to date of estimate (DOE), unless otherwise indicated
65 SE Outlook 2023 www.intellinews.com