
Page 491 - Area X - G
P. 491
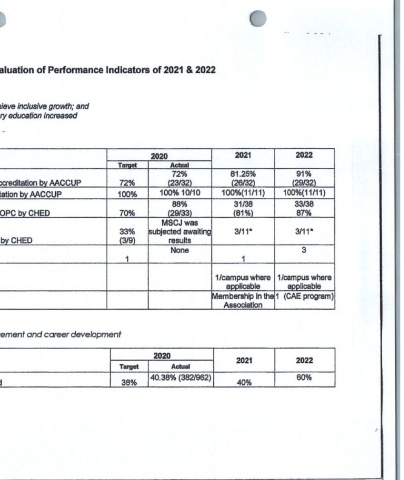
Monitoring and Evaluation of Performance Indicators of 2021 & 2022

 G O A L  1  -  A C A D E M IC  E X C E L L E N C E
 O rg a n iza tio n a l O u tc o m es :
 •   Relevant and quality tertiary education ensured to achieve inclusive growth; and
 •   Access of deserving but poor students to quality tertiary education increased

 KRA 1. Quality Programs
 Objective 1. To assure quality of programs
 KRA1:                               2020                2021           2022
 Quality Programs            Target       Actual
                                          72%           81.25%          91%
 1)  (a) Percentage of undergraduate programs granted with accreditation by AACCUP  72%  (23/32)  (26/32)  (29/32)
 (b) Percentage of graduate programs granted with accreditation by AACCUP  100%  100% 10/10  100% (11/11)  100%(11/11)
                                          88%            31/38         33/38
 2)  (a) Percentage of undergraduate programs granted with COPC bv CHED  70%  (29/33)  (81%)  87%
                                        MSCJ was
                              33%    subjected awaiting   3/11*        3/11*
 (b)  Percentage of graduate programs granted with COPC by CHED  (3/9)  results
 3)  No. of program(s) with COE/COD       None                           3
                               1                           1
 4. Certifications (skills-based programs)
 4)  4.1  National/Regional (TESDA)                 1/campus where  1/campus where
                                                       applicable     applicable
 4.2 International                                  Membership in the 1  (CAE program)
                                                      Association

 KRA 2 -  Q uality Graduates
 Objective 2. To ensure effective student lifecycle management and career development


                                      2020
 KRA 2 -  Q uality Graduates                             2021           2022
                              Target      Actual
                                     40.38%  (382/962)                  60%
 1)  Percentage of graduates (2 years prior) that are employed  38%  40%