Page 196 - Proceeding of Atrans Young Researcher's Forum 2019_Neat
P. 196

“Transportation for A Better Life:
                                                                              Smart Mobility for Now and Then”

                                                                                    23 August 2019, Bangkok, Thailand

                                                              between the transport modes and how the residents
                                                              in the province are in terms of their current living
                                                              status.
                                                                     After  the  necessary  data  collection,  the
                                                              analysis which focused on the categorical analysis of
                                                              the transport mode attributes (comfort, travel time
                                                              reliability, cleanliness, safety and connectivity) with
                                                              respect to the socio-economic factors which include
                                                              age,  individual  monthly  income  and  highest
                                                              educational  attainment.  The  transport  mode
                                                              attributes are listed and defined in Table 2.
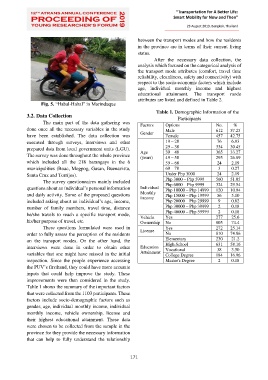
                   Fig. 5. “Habal-Habal” in Marinduque
                                                                      Table 1. Demographic Information of the
             3.2. Data Collection                                               Participants
                    The  main  part  of  the  data  gathering  was   Factors   Options           No.     %
             done once all the necessary  variables in the study           Male                  612   57.25
             have  been  established.  The  data  collection  was   Gender   Female              457   42.75
             executed  through  surveys,  interviews  and  other           19 – 28               76     6.93
             prepared data from local government units (LGU).              29 – 38               334   30.45
                                                                                                       33.27
                                                                           39 – 48
                                                                                                 365
             The survey was done throughout the whole province   Age       49 – 58               295   26.89
                                                               (years)
             which  included  all  the  218  barangays  in  the  6         59 – 68               24     2.19
             municipalities (Boac, Mogpog, Gasan, Buenavista,              69 – 78                3     0.27
             Santa Cruz and Torrijos).                                     Under Php 3000        24     2.19
                    The survey questionnaires mainly included              Php 3000 – Php 5999   560   51.05
                                                                                                 324
                                                                                                       29.54
                                                                           Php 6000 – Php 9999
             questions about an individual’s personal information   Individual   Php 10000 – Php 14999   120   10.94
             and daily activity. Some of the proposed questions   Monthly   Php 15000 – Php 19999   56   5.10
                                                               Income
             included asking about an individual’s age, income,            Php 20000 – Php 29999   9    0.82
             number  of  family  members,  travel  time,  distance         Php 30000 – Php 39999   2    0.18
                                                                                                  2
             he/she  travels  to  reach  a  specific  transport  mode,   Vehicle   Php 40000 – Php 59999   277   0.18
                                                                           Yes
                                                                                                        25.6
             his/her purpose of travel, etc.                   Ownership  No                     805    74.4
                    These  questions  formulated  were  used  in   License   Yes                 272   25.14
             order to fully assess the perception of the residents         No                    810   74.86
                                                                                                        21.2
             on  the  transport  modes.  On  the  other  hand,  the        Elementary            230   58.16
                                                                           High School
                                                                                                 631
             interviews  were  done  in  order  to  obtain  other   Education   Vocational       38     3.50
             variables that one might have missed in the initial   Attainment   College Degree   184   16.96
             inspection.  Since  the  people  experience  accessing        Master's Degree        2     0.18
             the PUV’s firsthand, they could have more accurate
             inputs  that  could  help  improve  the  study.  These
             improvements  were  then  considered  in  the  study.
             Table 1 shows the summary of the important factors
             that were collected from the 1103 participants. These
             factors  include  socio-demographic  factors  such  as
             gender, age, individual monthly income, individual
             monthly  income,  vehicle  ownership,  license  and
             their  highest  educational  attainment.  These  data
             were chosen to be collected from the sample in the
             province for they provide the necessary information
             that  can  help  to  fully  understand  the  relationship


                                                           171
   191   192   193   194   195   196   197   198   199   200   201