Page 208 - Proceeding of Atrans Young Researcher's Forum 2019_Neat
P. 208

“Transportation for A Better Life:
                                                                              Smart Mobility for Now and Then”

                                                                                    23 August 2019, Bangkok, Thailand

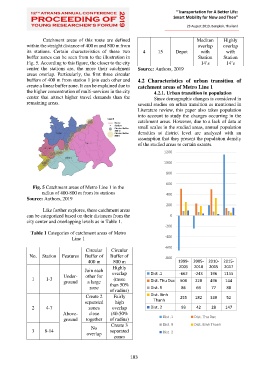
                    Catchment  areas  of  this  route  are  defined                     Medium      Highly
             within the straight distance of 400 m and 800 m from                        overlap    overlap
             its  stations.  Certain  characteristics  of  these  two   4   15   Depot    with       with
             buffer zones can be seen from to the illustration in                        Station    Station
             Fig. 5. According to this figure, the closer to the city                     14’s        14’s
             center  the  stations  are,  the  more  their  catchment   Source: Authors, 2019
             areas  overlap.  Particularly,  the  first  three  circular
             buffers of 400 m from station 1 join each other and   4.2  Characteristics  of  urban  transition  of
             create a linear buffer zone. It can be explained due to   catchment areas of Metro Line 1
             the higher concentration of multi-services in the city   4.2.1. Urban transition in population
             center  that  attract  higher  travel  demands  than  the   Since demographic changes is considered in
             remaining areas.                                 several studies on urban transition as mentioned in
                                                              Literature review, this paper also takes population
                                                              into account to study the changes occurring in the
                                                              catchment areas. However, due to a lack of data at
                                                              small scales in the studied areas, annual population
                                                              densities  at  district  level  are  analyzed  with  an
                                                              assumption that they present the population density
                                                              of the studied areas to certain extents.

                                                                          1200
                                                                          1000


                                                                           800


                Fig. 5 Catchment areas of Metro Line 1 in the              600
                    radius of 400-800 m from its stations                  400
             Source: Authors, 2019
                                                                           200
                    Like further explores, these catchment areas
             can be categorized based on their distances from the            0
             city center and overlapping levels as in Table 1.
                                                                          -200
               Table 1 Categories of catchment areas of Metro
                                 Line 1                                   -400

                                       Circular   Circular                -600
              No.  Station  Features  Buffer of   Buffer of               -800
                                        400 m      800 m                        1999-  2005-  2010-  2015-
                                                   Highly                        2005  2010   2015   2017
                                       Join each
                             Under-    other for   overlap          Dist .1      -662  -243   196    1155
               1     1-3                           (more
                             ground     a large   than 50%          Dist. Thu Duc  508  228   496    144
                                         zone                       Dist. 9       86    69     77     88
                                                  of radius)
                                       Create 2    Fairly           Dist. Binh   255    182   330     52
                                       separated    high             Thanh
               2     4-7                zones      overlap          Dist. 2       93    42     28    147
                             Above-      close    (40-50%
                             ground    together   of radius)             Dist .1       Dist. Thu Duc
                                                  Create 3               Dist. 9       Dist. Binh Thanh
                                         No
               3     8-14                         separated
                                        overlap                          Dist. 2
                                                    zones


                                                           183
   203   204   205   206   207   208   209   210   211   212   213