
Page 210 - Proceeding of Atrans Young Researcher's Forum 2019_Neat
P. 210
“Transportation for A Better Life:
Smart Mobility for Now and Then”
23 August 2019, Bangkok, Thailand
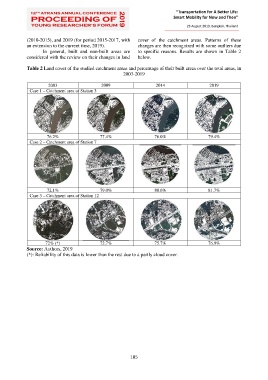
(2010-2015), and 2019 (for period 2015-2017, with cover of the catchment areas. Patterns of these
an extension to the current time, 2019). changes are then recognized with some outliers due
In general, built and non-built areas are to specific reasons. Results are shown in Table 2
considered with the review on their changes in land below.
Table 2 Land cover of the studied catchment areas and percentage of their built areas over the total areas, in
2003-2019
2003 2009 2014 2019
Case 1 – Catchment area of Station 3
76.2% 77.4% 76.0% 79.4%
Case 2 – Catchment area of Station 7
72.1% 79.0% 80.6% 81.7%
Case 3 – Catchment area of Station 12
72% (*) 72.7% 75.7% 76.9%
Source: Authors, 2019
(*): Reliability of this data is lower than the rest due to a partly cloud cover.
185