
Page 209 - Proceeding of Atrans Young Researcher's Forum 2019_Neat
P. 209
“Transportation for A Better Life:
Smart Mobility for Now and Then”
23 August 2019, Bangkok, Thailand
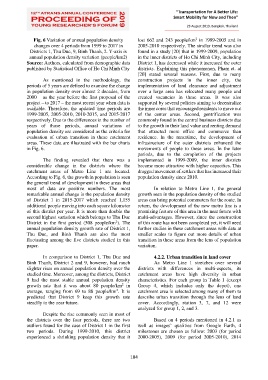
Fig. 6 Variation of annual population density lost 662 and 243 people/km in 1999-2005 and in
2
changes over 4 periods from 1999 to 2017 in 2005-2010 respectively. The similar trend was also
Districts 1, Thu Duc, 9, Binh Thanh, 2. Y-axis is found in a study [20] that in 1999-2009, population
annual population density variation (people/km2) in the inner districts of Ho Chi Minh City, including
Source: Authors, calculated from demographic data District 1, has decreased while it increased the outer
published by Statistical Office of Ho Chi Minh City districts. Explaining this phenomenon, Pham et. al
[20] stated several reasons. First, due to many
As mentioned in the methodology, the construction projects in the inner city, the
periods of 5 years are defined to examine the change implementation of land clearance and adjustment
in population density over almost 2 decades, from over a large area has relocated many people and
2000 – as the year before the first proposal of the created vacancies in these areas. It was also
project – to 2017 – the most recent year when data is supported by several policies aiming to decentralize
available. Therefore, the updated time periods are the inner cores that encouraged residents to move out
1999-2005, 2005-2010, 2010-2015, and 2015-2017 of the center areas. Second, gentrification was
respectively. Due to the differences in the number of commonly found in the central business districts due
years of those periods, annual variations of to the growth in their land value and renting demand
population density are considered as the criteria for that attracted more office and commerce than
evaluation of urban transition in these catchment residence. In the meantime, the development of
areas. These data are illustrated with the bar charts infrastructure of the outer districts enhanced the
in Fig. 6. movements of people to these areas. In the later
periods, due to the completion of the projects
The finding revealed that there was a implemented in 1999-2009, the inner districts
considerable change in the districts where the became more attractive with higher capacities. This
catchment areas of Metro Line 1 are located. dragged movement of settlers that has increased their
According to Fig. 6, the growth in population is seen population density since 2010.
the general trend of development in these areas that
most of data are positive numbers. The most In relation to Metro Line 1, the general
remarkable annual change is the population density growth seen in the population density of the studied
of District 1 in 2015-2017 which reached 1,155 areas can bring potential commuters for the route. In
additional people moving into each square kilometer return, the development of the new metro line is a
of this district per year. It is more than double the promising feature of this area in the near future with
second highest variation which belongs to Thu Duc multi-advantages. However, since the construction
District in the first period (508 people/km ). The of this route has not been completed yet, it will need
2
annual population density growth rate of District 1, further studies in these catchment areas with data at
Thu Duc, and Binh Thanh are also the most smaller scales to figure out more details of urban
fluctuating among the five districts studied in this transition in these areas from the lens of population
paper. variation.
In comparison to District 1, Thu Duc and 4.2.2. Urban transition in land cover
Binh Thanh, District 2 and 9, however, had much As Metro Line 1 stretches over several
slighter rises on annual population density over the districts with differences in multi-aspects, its
studied time. Moreover, among the districts, District catchment areas have high diversity in urban
9 had the most stable annual population density characteristics. For each group in Table 1 (except
2
growth rate that it was about 80 people/km in Group 4, which includes only the depot), one
2
average, ranging from 69 to 88 people/km . It is catchment area is selected among many of them to
predicted that District 9 keep this growth rate describe urban transition through the lens of land
steadily in the near future. cover. Accordingly, station 3, 7, and 12 were
analyzed for group 1, 2, and 3.
Despite the rise commonly seen in most of
the districts over the four periods, there are two Based on 4 periods mentioned in 4.2.1 as
outliers found for the case of District 1 in the first well as images’ qualities from Google Earth, 4
two periods. During 1999-2010, this district milestones are chosen as follow: 2003 (for period
experienced a shrinking population density that it 2000-2005), 2009 (for period 2005-2010), 2014
184