
Page 211 - Proceeding of Atrans Young Researcher's Forum 2019_Neat
P. 211
“Transportation for A Better Life:
Smart Mobility for Now and Then”
23 August 2019, Bangkok, Thailand
These images illustrate certain general
developments in land cover of the studied
catchment areas. Basically, several patterns of
land cover in these areas experiences the similar
trends that density declines gradually from the
stations as the focal points. Since the route has not
been used, the attractiveness of these stations can
hardly explain this phenomenon, but the
attractiveness of the route itself that is located
along the main highway.
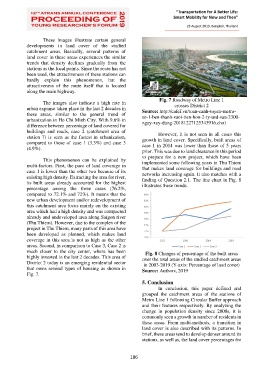
Fig. 7 Roadway of Metro Line 1
The images also indicate a high rate in crosses District 2
urban expanse taken place in the last 2 decades in Source: http://cafef.vn/toan-canh-tuyen-metro-
these areas, similar to the general trend of so-1-ben-thanh-suoi-tien-hon-2-ty-usd-sau-2300-
urbanization in Ho Chi Minh City. With 9.6% in ngay-xay-dung-20181227125343916.chn)
difference between percentage of land covered for
buildings and roads, case 2 (catchment area of However, it is not seen in all cases this
station 7) is seen as the fastest in urbanization, growth in land cover. Specifically, built areas of
compared to those of case 1 (3.3%) and case 3 case 1 in 2014 was lower than those of 5 years
(4.9%). prior. This was due to land clearance in this period
to prepare for a new project, which have been
This phenomenon can be explained by
multi-factors. First, the pace of land coverage in implemented some following years in Thu Thiem
case 1 is lower than the other two because of its that makes land coverage for buildings and road
networks increasing again. It also matches with a
existing high density. Extracting the area for river, finding of Question 2.1. The line chart in Fig. 8
its built areas already accounted for the highest
percentage among the three cases (76.2%, illustrates these trends.
compared to 72.1% and 72%). It means that the
new urban development and/or redevelopment of
this catchment area focus mainly on the existing
area which had a high density and was compacted
already and undeveloped area along Saigon river
(Thu Thiem). However, due to the complex of the
project in Thu Thiem, many parts of this area have
been developed as planned, which makes land
coverage in this area is not as high as the other
areas. Second, in comparison to Case 3, Case 2 is
much closer to the city center, where has been Fig. 8 Changes of percentage of the built areas
highly invested in the last 2 decades. This area of over the total areas of the studied catchment areas
District 2 today is an emerging residential sector in 2003-2019 (Y-axis: Percentage of land cover)
that owns several types of housing as shown in Source: Authors, 2019
Fig. 7.
5. Conclusion
In conclusion, this paper defined and
grouped the catchment areas of the stations of
Metro Line 1 following Circular Buffer approach
and their features respectively. By analyzing the
change in population density since 2000s, it is
commonly seen a growth in number of residents in
these areas. From multi-methods, a transition in
land cover is also described with its patterns. In
brief, these areas tend to develop denser around its
stations, as well as, the land cover percentages for
186