
Page 216 - Proceeding of Atrans Young Researcher's Forum 2019_Neat
P. 216
“Transportation for A Better Life:
Smart Mobility for Now and Then”
23 August 2019, Bangkok, Thailand
Table 1 Psychological constructs and their Number (%)
indicators. Frequency Non 88 22
No. <10 249 63
Constructs of Mean SD Cronbach's 1-3time/month 50 13
alpha
Item >3 time/week 9 2
Intention 3 3.01 0.97 0.90 Total 396 100
Attitude 3 4.08 0.73 0.82 4.2 Explanatory Factor Analysis
EFA on all 12 direct measurement items
Subjective 3 3.40 0.78 0.78 produced four factors. After Varimax rotation, This
Norm result in line with the basic TPB factors namely
Intention, Attitude, Subjective Norm and Perceived
Perceived Behavioral Control as show in Table 3.
Behavioral 3 4.01 0.71 0.68
Control
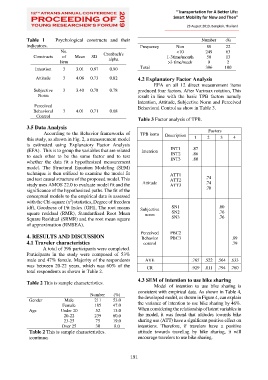
Table 3 Factor analysis of TPB.
3.5 Data Analysis
According to the Behavior frameworks of TPB items Description Factors
this study, as shown in Fig. 2, a measurement model 1 2 3 4
is estimated using Explanatory Factor Analysis
(EFA). This is to group the variables that are related Intention INT1 .87
to each other to be the same factor and to test INT2 .86
INT3
.80
whether the data fit a hypothesized measurement
model. The Structural Equation Modeling (SEM)
technique is then utilized to examine the model fit ATT1
and test causal structure of the proposed model. This ATT2 .74
study uses AMOS 22.0 to evaluate model fit and the Attitude ATT3 .74
significance of the hypothesized paths. The fit of the .70
conceptual models to the empirical data is assessed
2
with the Chi-square (x ) statistics, Degree of freedom
(df), Goodness of Fit Index (GFI), The root means Subjective SN1 .80
square residual (RMR), Standardized Root Mean norm SN2 .76
Square Residual (SRMR) and the root mean square SN3 .76
of approximation (RMSEA).
Perceived PBC2
4. RESULTS AND DISCUSSION Behavior PBC3 .89
4.1 Traveler characteristics control .79
A total of 396 participants were completed.
Participants in the study were composed of 53%
male and 47% female. Majority of the respondents AVE .765 .522 .564 .633
was between 20-22 years, which was 60% of the CR .929 .811 .794 .760
total respondents as shown in Table 2.
4.3 SEM of Intention to use bike sharing
Table 2 This is sample characteristics.
Model of intention to use bike sharing is
Number (%) consistent with empirical data. As shown in Table 4,
the developed model, as shown in Figure 4, can explain
Gender Male 211 53.0
Female 185 47.0 the variance of intention to use bike sharing by 46%.
Age Under 20 52 13.0 When considering the relationship of latent variables in
20-22 239 60.0 the model, it was found that attitudes towards bike
23-25 75 19.0 sharing use (ATT) have a significant positive effect on
Over 25 30 8.0 intentions. Therefore, if travelers have a positive
Table 2 This is sample characteristics. attitude towards traveling by bike sharing, it will
(continue) encourage travelers to use bike sharing.
191