Page 221 - Proceeding of Atrans Young Researcher's Forum 2019_Neat
P. 221

“Transportation for A Better Life:
                                                                              Smart Mobility for Now and Then”

                                                                                    23 August 2019, Bangkok, Thailand

             Table  1.  The  Pedestrian  Environmental  Quality      Data  for  the  measurement  of  evaluation
             Score  (PEQS):  Indicator  Score  Value  for  Street   indexes were collected by observations based on the
             Segment Score, Intersection Score Values Based on   street segment and intersection visualization results.
             Expert Survey Findings (n= 10)                   Google  map, as a Web-based GIS  map is used to
                                                              create  maps  to  visually  display  our  street  and
                                            Indicator   Indicator   intersection findings for selected areas by spatially
                                   Indicator
                             Indicator     Response   Response
               Factor  Indicator   Response                   joining the PEQS score to its corresponding street
                             Score          Category   Category Score,
                                   Category                   segment  or  intersection  using  unique  street  and
                                            Score   Weighted
                                                              intersection identifiers.
             Intersection

              Intersection  Crosswalk  4.3  4 Directions  9.8  42.1
                Safety                                        Table 2. PEQS score interpretation
                                   3 Directions  8.4  36.1         Visualization   PEQS       Interpretation
                                   2 Directions  7.7  33.1                         Score
                                   1 Directions  6.5  28.0     Intersection  Segment
                                    None      0       0.0                         81-100   Ideal pedestrian
                                                                                          conditions exist
                    Pedestrian signal  4.1  Yes   10  41.0
                                                                                  61 – 80   Reasonable pedestrian
                                     No       2       8.2
                    No turn on red  3.1  Yes  8       24.8                                conditions exist
                                     No       4       12.4                        41 – 60   Basic pedestrian
              Intersection  Trees   3.6  Yes  8.2     29.5                                conditions exist
                Design                                                            21 – 40   Poor pedestrian
                                     No      2.3      8.3
             Street                                                                       conditions exist
             Segment                                                              0 – 20   Environment not
                                                                                          suitable for pedestrians
                Traffic Number of lanes  1.8  1  6    10.8

                                     2       5.5      9.9
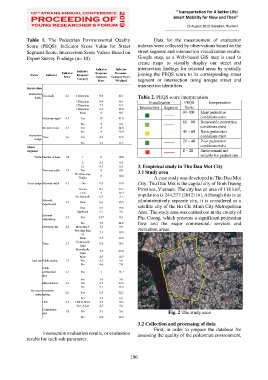
                                     ≥3      4.7      8.5     3. Empirical study in Thu Dau Mot City
                    Two-way traffic  1.7  Yes  4      6.8     3.1 Study area
                                  No (One-way   6     10.2
                                    Traffic)                         A case study was developed in Thu Dau Mot
             Street design Sidewalk width  4.1  ≥ 3m  9.5  39.0  City. Thu Dau Mot is the capital city of Binh Duong
                                    1m-3m    8.7      35.7    Province, Vietnam. The city has an area of 118 km²,
                                    < 1m      4       16.4    population is 244,277 (2012) [6], Although this is an
                                   No Sidewalk  0.5   2.1
                    Sidewalk   3.7  None     9.6      35.5    administratively separate city, it is considered as a
                    impediments
                                     Few     4.2      15.5    satellite city of the Ho Chi Minh City Metropolitan
                                   Significant  2.1   7.8     Area. The study area was carried out in the county of
                    Sidewalk   3.3   Yes     2.57     8.5
                    obstructions                              Phu Cuong, which presents a significant pedestrian
                                     No      7.5      24.8    flow  and  the  major  commercial,  services  and
                    Driveway cuts  2.8  More than 5  3.2  9.0
                                  Few (less than   7.1  19.9  recreation areas.
                                     5)
                                    None     9.5      26.6
                                   Continuously
                    Trees     3.7            9.8      36.3
                                    Lined
                                   Sporadically   7.5  27.8
                                    Lined
                                    None     2.9      10.7
               Land use Public seating  1.7  Yes  5.3  9.0
                                     No      4.6      7.8
                    Public
                    art/historical   2.1  Yes  7      14.7
                    sites
                                     No      3.6      7.6
                    Mixed landuse  2.9  Yes  8.2      23.8
                                     No      5.1      14.8
               Perceived Pedestrian   2.6  Yes  8.5   22.1
                 safety lighting
                                     No      2.5      6.5
                    Litter    2.3  Little to None  8.5  19.6
                                   Yes- A Lot  2.5    5.8
                    Construction   1.8  Yes  3.1      5.6
                    sites                                                   Fig. 2 The study area
                                     No      6.8      12.2
                                                              3.2 Collection and processing of data
                                                                     First,  in  order  to  prepare  the  database  for
                    intersection evaluation results, or evaluation   assessing the quality of the pedestrian environment,
             results for each sub parameter.


                                                           196
   216   217   218   219   220   221   222   223   224   225   226