
Page 226 - Proceeding of Atrans Young Researcher's Forum 2019_Neat
P. 226
“Transportation for A Better Life:
Smart Mobility for Now and Then”
23 August 2019, Bangkok, Thailand
An observation period of ten minutes was data point once the pedestrians behind the Andas
allotted to count the pedestrians who attempted to cleared the area. A push was classified into two
climb the Andas. The total number of pedestrians categories using a dummy variable, M, where M=1
that attempted to climb the Andas was obtained by when the push caused the Andas to move, while
dividing the number of attempted climbs by the M=0 when the Andas was not displaced along the
percentage of the visible Andas perimeter. The push direction. The length of pushing pedestrians
Hustle Rate for a road section was generated through parallel to the pushing direction was measured. A
dividing the total number of pedestrians that length that corresponds to M=1 was measured as the
attempted to climb the Andas by the ten-minute distance from the Andas to the last person to join the
timeframe. The causality between the hustle rate and pushing group right before the instant the Andas
the road width was investigated through the started moving along the push direction. A length
regression analysis. that corresponds to M=0 was measured as the
distance from the Andas to the last person to join the
group when the Andas did not displace, or from the
Andas to the person who deflects opposite the
direction of the push right after joining the group.
The data points in the two categories (M=1
and M=0) were subjected to the Analysis of
Variance Test to determine the significance between
the differences in the mean lengths of the two
groups. Using the 50 percentile density within two
th
meters behind the Andas as found in Chapter 3.3 and
Fig 4 Assumed percentage of total pedestrians the pushing area (determined using the mean length
attempting to climb the Andas per side of pushing pedestrians and the Andas width), the
average number of people needed for a successful
3.6 Time Ratios push was obtained.
The movement of the Black Nazarene
procession may be described by the duration of its
movement and stagnancy along a road segment. The 4. Results
time ratio analysis characterizes the movement of the 4.1 General Results
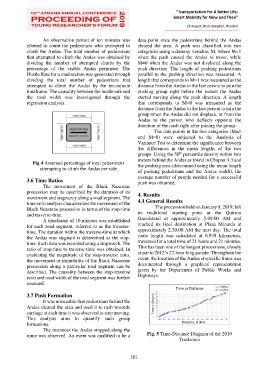
Black Nazarene procession in terms of the stop-time The procession held on January 9, 2019, left
and traverse-time. its traditional starting point at the Quirino
A timeframe of 10 minutes was established Grandstand at approximately 5:09:00 AM and
for each road segment, referred to as the traverse- reached its final destination at Plaza Miranda at
time. The duration within the traverse-time at which approximately 2:30:00 AM the next day. The total
the Andas was stagnant is determined as the stop- route length was calculated at 6.938 kilometers,
time. Such data was recorded using a stopwatch. The traversed for a total time of 21 hours and 21 minutes.
ratio of stop-time to traverse-time was obtained. In This has been one of the longest processions; closely
evaluating the magnitude of the stop-traverse ratio, at par to 2012’s 22-hour long parade. Throughout the
the movement or immobility of the Black Nazarene event, the location of the Andas at specific times was
procession along a particular road segment can be documented through a graphical representation
described. The causality between the stop-traverse given by the Department of Public Works and
ratio and road width of the road segment was further Highways.
assessed.
3.7 Push Formation
It was noticeable that pedestrians behind the
Andas cleared the area and used it to rush towards
carriage at each time it was observed to stop moving.
This analysis aims to quantify such group
formations.
The instances the Andas stopped along the
route was observed. An event was qualified to be a Fig. 5 Time-Distance Diagram of the 2019
Traslacion
201