
Page 231 - Proceeding of Atrans Young Researcher's Forum 2019_Neat
P. 231
“Transportation for A Better Life:
Smart Mobility for Now and Then”
23 August 2019, Bangkok, Thailand
Fig. 12 that show these data display similar procession hours during the 2019 procession. Since
exponential behavior. rerouting might not prove effective in reducing the
Using the equation of the curve generated in aggressiveness due to the prevalent tight roads of
Fig. 10, the theoretical hustle rates on all road widths Quiapo where the procession is concentrated,
along the procession route were determined. The another way to reduce hustle rate would be to
variation of hustle rates along the route alongside its decrease the stop-traverse ratios along road
road widths are presented in Fig. 13. The inverse segments. Reduced top-traverse ratios might prompt
relationship between hustle rate and road width for a safer procession due to decreased hustle rate as
defined earlier is evident in these graphs. Using this well as result in a smoother and faster movement for
data, the hustle rates along the procession route are the Andas.
presented in terms of levels, which are defined in
Fig. 14. 4.4 Push Formation Analysis
Stoppage to the procession movement is
inevitable along the procession route. Moreover, it
was discussed that the parade movement was
inhibited by friction-like forces brought about by the
reduced traverse width at narrow road sections.
Pedestrians play an important role in the procession
especially in instances that the Andas stops. It was
observed that the Andas pushers highly influenced
Fig. 13 Variation of theoretical hustle rates with the forward movement of the Andas.
respect to the road widths
Theoretical hustle rate levels along the
procession route are presented in Fig. . As observed,
most road segments fall on level three with hustle
rates ranging from 40 to 50 people per minute. Level
one hustle rates can only be observed on the starting
road segment of the procession, while level two
hustle rates can be observed along Jones Bridge and
its immediate adjacent road segments. The segments
with the highest hustle rate that reaches more the 50 Fig. 15 Pedestrian push formation
people per minute can be found on roads situated on
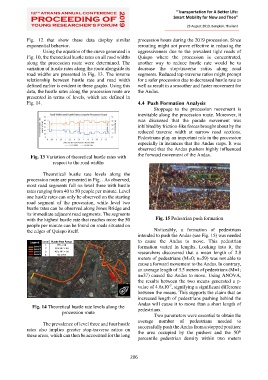
the edges of Quiapo itself. Noticeably, a formation of pedestrians
intended to push the Andas (see Fig. 15) was needed
Level Hustle Rate Range to cause the Andas to move. This pedestrian
1 HR < 30 formation varied in lengths. Looking into it, the
2 30 ≤ HR < 40
3 40 ≤ HR < 50 researchers discovered that a mean length of 2.8
4 50 ≤ HR
meters of pedestrians (M=0; n=59) was not able to
cause a forward movement to the Andas. In contrary,
an average length of 3.5 meters of pedestrians (M=1;
n=37) caused the Andas to move. Using ANOVA,
the results between the two means generated a p-
value of 4.6x10 , signifying a significant difference
-7
between the means. This supports the claim that an
increased length of pedestrians pushing behind the
Fig. 14 Theoretical hustle rate levels along the Andas will cause it to move than a short length of
procession route pedestrians.
Two parameters were essential to obtain the
The prevalence of level three and four hustle average number of pedestrians needed to
rates also implies greater stop-traverse ratios on successfully push the Andas from a stopped position:
th
the area occupied by the pushers and the 50
these areas, which can then be accounted for the long
percentile pedestrian density within two meters
206