
Page 228 - Proceeding of Atrans Young Researcher's Forum 2019_Neat
P. 228
“Transportation for A Better Life:
Smart Mobility for Now and Then”
23 August 2019, Bangkok, Thailand
estimate of the participants in the procession, the
DENSITY (ped/sq.m.) following assumptions were considered:
CAMERA: 06 Row 1 4.0 5.8 6.5 6.8 6.3 6.5 6.3 7.5 6.3 8.0 10.0 9.0 7.3 6.5 7.0 8.0 6.0 4.0 5.5 4.5 6.3 6.0 3.3 4.8
OVERALL GRID WIDTH (m): 6.0 Row 2 3.5 4.3 5.3 5.0 4.8 3.5 4.8 6.8 7.0 12.0 7.8 9.5 ANDAS 7.8 8.3 4.0 6.3 4.3 5.3 6.0 4.0 5.0 4.5 4.3 2.8 1. The ropes attached in front of the Andas are
Row 3 5.3 4.8 5.0 4.8 6.8 3.0 7.5 5.3 8.3 12.5 9.0 7.5 8.8 11.0 10.0 11.3 8.3 8.8 6.8 8.5 8.3 6.3 9.0 4.3
CAMERA: 07 Row 1 5.5 6.5 6.5 4.8 5.0 6.3 5.5 3.5 5.3 4.8 3.8 4.5 5.0 4.3 3.0 3.8 5.3 8.3 6.8 8.8 5.0 4.0 5.3 5.8
OVERALL GRID WIDTH (m): 20.0 Row 2 4.3 3.3 4.0 4.5 4.5 3.3 4.8 6.8 5.0 4.5 5.0 4.3 4.0 5.5 3.8 4.8 7.3 7.3 4.8 5.5 4.3 4.5 2.5 3.3 straight at the instant of estimating the
Row 3 6.5 3.8 4.3 4.5 1.8 3.0 6.0 5.8 3.0 3.8 4.3 5.5 5.5 4.0 5.8 4.0 5.0 5.3 6.3 7.0 4.8 2.8 4.8 3.0
Row 4 4.5 4.3 7.5 5.5 4.8 4.3 3.3 4.0 3.5 4.5 5.3 7.3 5.0 5.8 4.5 3.5 7.0 8.3 8.3 6.0 5.0 3.8 3.5 5.5 number of pedestrians ahead of the Andas.
Row 5 5.0 2.5 3.5 5.8 2.0 5.0 4.5 2.5 5.8 2.8 7.0 6.5 6.3 5.5 5.3 7.5 7.5 5.8 3.8 4.0 4.5 3.3 4.5 3.3
Row 6 4.3 2.8 2.3 4.8 3.5 6.0 4.3 4.0 6.0 2.5 4.5 7.8 ANDAS 7.0 5.0 3.8 1.3 9.3 9.8 4.0 2.0 4.8 5.0 2.8 3.8 Thus, the parade length ahead of the Andas
Row 7 3.3 2.5 3.5 2.3 3.3 3.3 2.5 3.0 2.3 2.8 5.0 4.8 5.0 5.5 1.3 0.8 10.8 9.0 3.0 4.3 2.8 3.3 3.5 3.0
Row 8 4.5 3.3 4.5 2.8 2.8 3.0 2.8 1.5 3.0 1.3 2.8 5.8 4.3 4.0 5.5 3.8 5.0 5.0 2.5 2.8 2.5 4.3 2.5 5.0 is the length of the ropes, which is 50
Row 9 3.3 2.8 3.3 2.0 2.8 3.8 1.5 1.3 1.8 2.5 2.8 4.0 4.3 4.0 4.3 6.3 5.0 5.0 2.5 2.8 2.5 4.3 2.5 5.0
Row 10 3.3 4.5 3.5 4.0 3.5 3.3 2.5 1.8 2.3 3.3 4.0 4.3 8.3 8.8 7.8 8.0 4.8 5.3 4.5 4.8 4.0 5.5 4.0 5.5
Row 1 4.8 4.3 3.8 4.5 5.3 5.0 4.3 5.3 4.5 7.8 7.3 11.8 6.5 6.3 6.8 6.8 7.0 7.5 6.5 6.8 4.8 5.0 3.8 3.8
CAMERA: 08 meters;
OVERALL GRID WIDTH (m): 8.0 Row 2 2.3 5.0 4.3 4.8 5.3 5.3 5.3 5.0 6.5 8.5 7.0 11.3 ANDAS 6.8 8.3 9.0 8.3 6.3 5.3 7.8 7.5 5.0 6.0 5.0 5.8
Row 3 6.5 5.8 5.0 5.5 5.8 5.3 5.8 6.8 7.0 8.5 7.5 10.5 6.8 8.8 9.3 9.5 9.8 6.8 8.5 7.5 5.5 7.3 4.8 6.5 2. The procession length is constant along the
Row 4 6.0 5.3 4.8 5.0 5.5 4.3 4.5 4.3 5.0 5.8 5.8 7.5 9.5 11.0 11.3 10.3 10.0 7.5 10.5 10.0 7.5 8.5 7.8 8.0
Row 1 4.5 6.3 6.5 4.8 4.3 5.0 6.5 7.3 5.0 9.8 9.0 9.8 7.3 6.8 5.0 5.3 4.8 5.8 3.8 4.8 5.3 5.3 6.5 7.5 route; and
CAMERA: 10
OVERALL GRID WIDTH (m): 8.0 Row 2 4.8 5.0 7.0 4.0 5.3 6.5 6.8 6.8 7.3 10.0 10.5 11.0 ANDAS 3.3 6.5 6.5 5.8 4.8 5.8 3.5 4.0 2.5 2.8 8.0 7.8
Row 3 4.5 5.8 4.0 6.5 4.8 7.3 5.8 7.0 6.3 10.3 10.0 10.0 3.3 6.5 6.5 5.8 4.8 5.8 3.5 4.0 2.5 2.8 8.0 7.8
Row 4 5.8 4.2 5.0 6.2 6.0 8.3 5.3 8.3 8.0 11.8 7.5 10.8 2.8 5.5 3.3 6.0 4.3 5.8 1.8 6.3 2.5 2.3 8.0 7.5 3. The variation of pedestrian densities at
Row 1 3.3 3.8 4.3 3.3 4.8 3.8 3.0 5.0 4.3 6.8 6.3 9.0 7.8 6.3 7.8 6.8 6.0 6.0 5.8 6.0 3.8 4.0 3.5 4.3
CAMERA: 11
OVERALL GRID WIDTH (m): 6.0 Row 2 4.0 4.3 3.0 4.0 3.0 5.8 3.0 4.0 5.3 6.0 8.0 9.8 ANDAS 7.3 7.3 7.0 6.8 4.5 6.5 4.0 5.8 4.8 5.8 3.8 5.3 different distances from the Andas is similar
Row 3 3.8 4.3 3.5 4.3 4.5 4.3 4.8 4.3 5.5 5.8 7.8 8.3 4.8 6.3 2.0 5.0 3.8 4.5 4.3 3.5 2.0 2.5 2.5 2.5
along the route.
AVERAGE DENSITIES 4.46 4.35 4.60 4.58 4.41 4.77 4.61 4.89 5.16 6.49 6.56 7.92 6.00 6.55 5.83 6.04 6.29 6.41 5.18 5.45 4.40 4.55 4.74 5.05
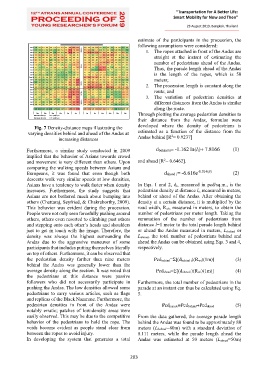
24m 20m 16m 12m 8m 4m 4m 8m 12m 16m 20m 24m Through plotting the average pedestrian densities to
Minimum density: 12.5 ped/sq.m
Maximum density: 0.75 ped/sq.m their distance from the Andas, formulas were
Fig. 7 Density-distance maps illustrating the developed where the density of pedestrians is
varying densities behind and ahead of the Andas at estimated as a function of the distance from the
2
increasing distances Andas behind [R = 0.9237]
Furthermore, a similar study conducted in 2009 dbehind i= -1.162 ln(li)+ 7.8166 (1)
implied that the behavior of Asians towards crowd
2
and movement is very different than others. Upon and ahead [R = 0.6462].
comparing the walking speeds between Asians and
Europeans, it was found that even though both dahead i= -6.616e -0.014(li) (2)
descents walk very similar speeds at low densities,
Asians have a tendency to walk faster when density In Eqs. 1 and 2, di, measured in ped/sq.m., is the
increases. Furthermore, the study suggests that pedestrian density at distance li, measured in meters,
Asians are not bothered much about bumping into behind or ahead of the Andas. After obtaining the
others (Chattaraj, Seyfried, & Chakraborthy, 2009). density at a certain distance, it is multiplied by the
This behavior was evident during the procession. road width, Rwi, measured in meters, to obtain the
People were not only seen forcefully pushing around number of pedestrians per meter length. Taking the
others, others even resorted to climbing past others summation of the number of pedestrians from
and stepping onto each other’s heads and shoulders distance l=1 meter to the total parade length behind
just to get in touch with the image. Therefore, the or ahead the Andas measured in meters, Lbehind or
density was always the highest surrounding the Lahead, the total number of pedestrians behind and
Andas due to the aggressive maneuver of some ahead the Andas can be obtained using Eqs. 3 and 4,
participants that includes putting themselves literally respectively.
on top of others. Furthermore, it can be observed that
the pedestrian density farther than nine meters Pedbehind=Σ[(dbehind i)(Rwi)(1m)] (3)
behind the Andas was generally lower than the
average density along the section. It was noted that Pedahead=Σ[(dahead i)(Rwi)(1m)] (4)
the pedestrians at this distance were passive
followers who did not necessarily participate in Furthermore, the total number of pedestrians in the
pushing the Andas. The low densities allowed some parade at an instant can thus be calculated using Eq.
pedestrians to carry various articles, such as flags 5.
and replicas of the Black Nazarene. Furthermore, the
pedestrian densities in front of the Andas were Pedparade=Pedbehind+Pedahead (5)
notably erratic; patches of low-density areas were
easily observed. This may be due to the competitive From the data gathered, the average parade length
behavior of the pedestrians to hold the rope. The behind the Andas was found to be approximately 80
voids become evident as people stand clear from meters (Lbehind=80m) with a standard deviation of
between the ropes to avoid injury. 8.111 meters, while the parade length ahead the
In developing the system that generates a total Andas was estimated at 50 meters (Lahead=50m)
203